
Python Libraries: Pandas
Pandas is a Python library for building and manipulating data tables. To use Pandas, it must first be imported as follows:
import pandas as pdDataFrame
Data tables in Pandas are called DataFrames. Use pd.DataFrame() to create a new DataFrame as follows:
Step 1: collect the numerical data into a nested list, where the inner lists are the rows separated by commas
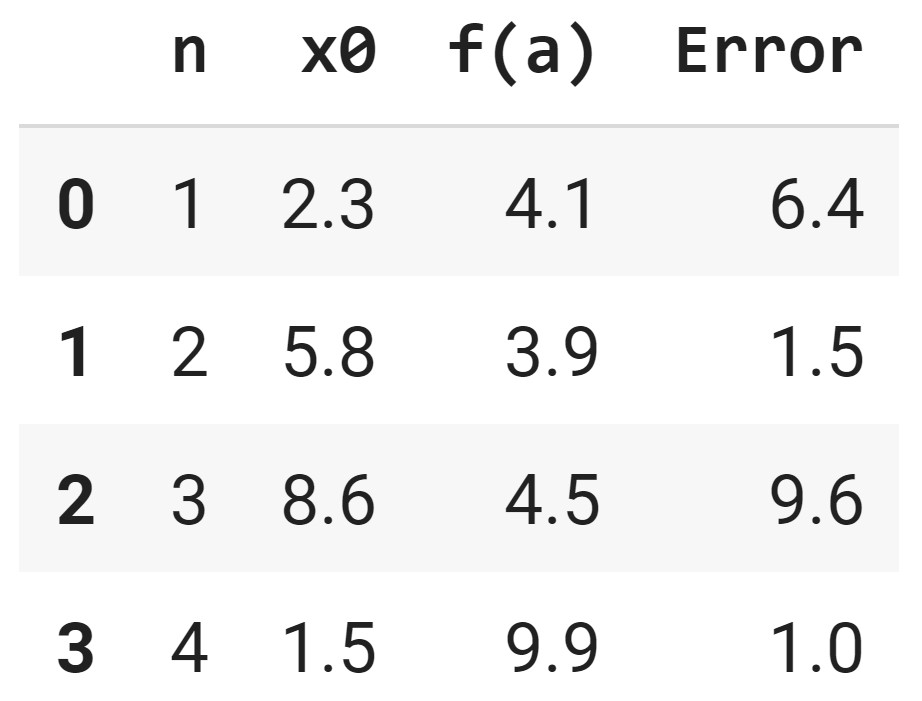
The first row is [1, 2.3, 4.1, 6.4] and the second row is [2, 5.8, 3.9, 1.5], therefore the start of the table will be [[1, 2.3, 4.1, 6.4],[2, 5.8, 3.9, 1.5], ...]
data = [[1, 2.3, 4.1, 6.4],
        [2, 5.8, 3.9, 1.5],
        [3, 8.6, 4.5, 9.6],
        [4, 1.5, 9.9, 1.0]]
Step 2: pass the data as the first input into the pd.DataFrame function. The columns is an optional input to assign table headers
table = pd.DataFrame(data, columns=["n","x0","f(a)","Error"])Step 3: display the DataFrame
display(table)The full code:
import pandas as pd

data = [[1, 2.3, 4.1, 6.4],
        [2, 5.8, 3.9, 1.5],
        [3, 8.6, 4.5, 9.6],
        [4, 1.5, 9.9, 1.0]]
table = pd.DataFrame(data, columns=["n","x0","f(a)","Error"])
display(table)
Read Excel
The read_excel can be used to import data from excel (.xlsx) files and returns a Pandas DataFrame
data = pd.read_excel(PATH_TO_EXCEL_FILE)where the PATH_TO_EXCEL_FILE can be the file path on your computer or a URL link
data = pd.read_excel("https://engcourses-uofa.ca/wp-content/uploads/Ashour-Pilley.xlsx")
display(data)
Read CSV
The read_csv can be used to import data from comma-separated-values (.csv) files and returns a Pandas DataFrame
data = pd.read_csv(PATH_TO_CSV_FILE)where the PATH_TO_CSV_FILE can be the file path on your computer or a URL link
data = pd.read_csv("https://engcourses-uofa.ca/wp-content/uploads/Ashour-Pilley.csv")
display(data)
Accessing Data
- First 5 Rows:
data.head() - Last 5 Rows:
data.tail() - “col” column:
data["col"] - i-th row:
data.iloc[i] - “col” column and i-th row:
data["col"][i]
import pandas as pd

data = [[1, 2.3, 4.1, 6.4],
        [2, 5.8, 3.9, 1.5],
        [3, 8.6, 4.5, 9.6],
        [4, 1.5, 9.9, 1.0],
        [5, 3.7, 8.9, 1.5],
        [6, 9.7, 3.5, 6.9],
        [7, 8.8, 1.4, 9.6]]
data = pd.DataFrame(data, columns=["n","x0","f(a)","Error"])
display(data)
display(data.head())
display(data.tail())
display(data["Error"])
display(data.iloc[0])
display(data["Error"][0])