
Review of single and multi-degree of freedom (mdof) systems: Aerodynamics Excitation
A relatively common excitation which occurs in diverse situations from subsea pipelines to slender tall structures is due to vortex shedding. This shedding creates a differential pressure perpendicular to the fluid flow. For lower Reynolds numbers (Re  300) the vortex shedding frequency is estimated to the Strouhal number
  by
by
![\[ f_s=\frac{SU}{D} \]](https://engcourses-uofa.ca/wp-content/ql-cache/quicklatex.com-d9631f48ea7c236265d655a80bddbfc0_l3.png "Rendered by QuickLaTeX.com")
where  is the shedding frequency,
  is the velocity of the external flow and
  is a characteristic dimension (e.g. diameter of the building or the pipeline). Assuming that the lift force per unit length is harmonic it can be written as
![\[ F_{L/L}=\frac{1}{2}C_L \rhoU^2D\sin(\omega_st) \]](https://engcourses-uofa.ca/wp-content/ql-cache/quicklatex.com-38b4b35021c8bbb09807fce9ea85f0e5_l3.png "Rendered by QuickLaTeX.com")
where  lift coefficient,
  density of the fluid (mass), and
For the case of a bluff body, the total force to the flow is modelled as
![\[ F_{L/L}=\frac{1}{2}C_L \rho A_fU^2\sin(\omega_st) \]](https://engcourses-uofa.ca/wp-content/ql-cache/quicklatex.com-6c6ef62235ade7648544addaed6ee91f_l3.png "Rendered by QuickLaTeX.com")
where  is the frontal area
  to the flow. Because of the complexity of the flow there can be components of alternating forces at 1/2 the frequency estimated by the Strouhal number as well as at twice the .
It should be noted that the shape of the body can also have a major influence on the effective force magnitude. Catastrophic examples include the Tacoma Narrows Bridge and the destruction of powerlines that change their X-sectional shape due to icing.
For most of these lower Reynold’s number flows
![\[ 0.18\leq S \leq 0.22 \]](https://engcourses-uofa.ca/wp-content/ql-cache/quicklatex.com-826c06fa61cd95958c396d908ab8a842_l3.png "Rendered by QuickLaTeX.com")
Example
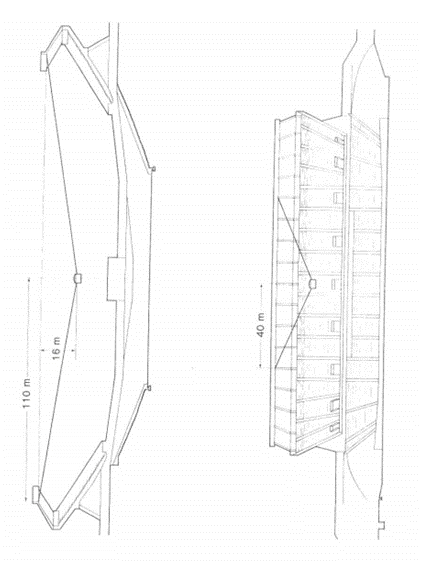
In order to produce a relatively uniform acoustic field to the audience in an open stadium, the sound system is often suspended above the center of the playing surface. (This allows the distance from the source to the audience to be approximately the same for all fans.) This is shown diagrammatically, with typical dimensions in Figure 1. Especially in northern climates, there is the potential for the system to be covered in ice and the usual porous surfaces are replaced by an effectively solid “bluff” body that can be excited as a result of wind induced vortices being shed from the body. Alternate shedding from the upper and lower surfaces cause a pressure differential and therefore a vertical excitation of the body. The frequency  of this excitation is related to the wind velocity and a representative vertical dimension (taken as the total height of the system in this case, Figure 2) through the Strouhal number given by
![\[ S = \frac{fD}{U} \]](https://engcourses-uofa.ca/wp-content/ql-cache/quicklatex.com-2511321c8187e13e81c9024435ce61b3_l3.png "Rendered by QuickLaTeX.com")
( = 0.22 for this outdoor situation). The concern is that the frequency of vortex shedding could match the natural frequency and result in large even catastrophic oscillations of the sound system (google Tacoma Narrows Bridge).
(a) The 6350 kg (14,000 lb) sound system shown is supported by four 25 mm (1 inch) diameter bridge strand cables ( psi). Calculate the natural frequency for vertical vibrations and then determine the corresponding wind speed at which these large vibrations occur.
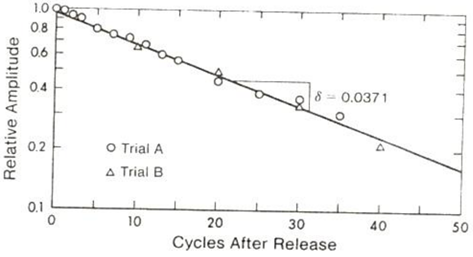
(b) To check the calculations above, a test was done on the actual system and the damping of the system also measured using a video after the sound system was excited in the vertical direction. The natural frequency was measured to be 0.45 Hz and the logarithmic decrement  determined from two trials plotted in Figure 3. Determine the damping ratio
  . Note: even though the damping ratio is quite low, it is important as it limits the amplitude of the system at resonance.
(c) Estimate the maximum resonant deflection of the sound system.
(a) For a cable of length  ,
,
![\[ k_c=\frac{EA}{L} \]](https://engcourses-uofa.ca/wp-content/ql-cache/quicklatex.com-9aef2c4744b7b76642cd4e648b16114f_l3.png "Rendered by QuickLaTeX.com")
therefore for the 4 cables, the  for the vertical motion
![\[ k_\text{eff}=\frac{4EA}{L}\cos^2\theta \]](https://engcourses-uofa.ca/wp-content/ql-cache/quicklatex.com-6d6fa3175d829c2c6be0393c2bcf68b6_l3.png "Rendered by QuickLaTeX.com")
![\[ L=\sqrt{(110)^2+(40)^2+(16)^2}=118.1\ \text{m}\]](https://engcourses-uofa.ca/wp-content/ql-cache/quicklatex.com-65c28f0695c7bdd31532f28a0077abe2_l3.png "Rendered by QuickLaTeX.com")
![\[ \cos\theta=\frac{16}{118.1}=0.1355 \]](https://engcourses-uofa.ca/wp-content/ql-cache/quicklatex.com-cc004bd8719dbb8d04b0d264913930f9_l3.png "Rendered by QuickLaTeX.com")
![\[ k_\text{eff}=\frac{4\frac{\pi}{4}(1)^2 \cdot 20 \cdot 10^6(0.1355)^2}{(118.1)(39.96\ \text{ in/m})} \]](https://engcourses-uofa.ca/wp-content/ql-cache/quicklatex.com-63cb4c81ad2edd069b02a885a86067a2_l3.png "Rendered by QuickLaTeX.com")
![\[ =244.4 \ \text{lbs/in} \]](https://engcourses-uofa.ca/wp-content/ql-cache/quicklatex.com-c6c2cbfbf928dcaf53b13abbc744efd8_l3.png "Rendered by QuickLaTeX.com")
![\[ P=\sqrt{\frac{k_\text{eff}\cdot386}{14,000}}=2.60 \ \text{rads/sec} \]](https://engcourses-uofa.ca/wp-content/ql-cache/quicklatex.com-f5df8df89ef1c3297dbefa5ad52178cf_l3.png "Rendered by QuickLaTeX.com")
![\[=0.413 \ \text{Hz} \]](https://engcourses-uofa.ca/wp-content/ql-cache/quicklatex.com-8cc347126d115b02e48aa66e93b14a5f_l3.png "Rendered by QuickLaTeX.com")
wind speed:
![\[ U=\frac{fD}{0.22} \]](https://engcourses-uofa.ca/wp-content/ql-cache/quicklatex.com-73f32b2fc886ae31ae030fb4e7b5753d_l3.png "Rendered by QuickLaTeX.com")
![\[=\frac{0.413(\frac{3.6\cdot39.96}{12})}{0.22}\]](https://engcourses-uofa.ca/wp-content/ql-cache/quicklatex.com-b255593230b02197871d7870b4b4ff1f_l3.png "Rendered by QuickLaTeX.com")
![\[=22.6ft/s\]](https://engcourses-uofa.ca/wp-content/ql-cache/quicklatex.com-d810df6ee85ba8d999a5b5c3e00c8ba2_l3.png "Rendered by QuickLaTeX.com")
![\[ =15.4 \text{mph} \ \text{ (24.8km/h)} \]](https://engcourses-uofa.ca/wp-content/ql-cache/quicklatex.com-c79ffb29f866df1cf9207df7b8c3f021_l3.png "Rendered by QuickLaTeX.com")
(b) For low damping ratio:
![\[ \delta=\frac{2\pi\zeta}{\sqrt{1-\zeta^2}}\approx2\pi\zeta \]](https://engcourses-uofa.ca/wp-content/ql-cache/quicklatex.com-e69d16ffdcae670a8b1a7c5aa3d91046_l3.png "Rendered by QuickLaTeX.com")
Therefore:
![\[ \zeta=\frac{\delta}{2\pi} \]](https://engcourses-uofa.ca/wp-content/ql-cache/quicklatex.com-202cf509843e1fe77e79a93338aed11a_l3.png "Rendered by QuickLaTeX.com")
![\[ \zeta=\frac{0.037}{2\pi} \]](https://engcourses-uofa.ca/wp-content/ql-cache/quicklatex.com-813993a53e4cf385b5478454658e7b54_l3.png "Rendered by QuickLaTeX.com")
![\[ \zeta=\underline{\underline{0.00589}} \]](https://engcourses-uofa.ca/wp-content/ql-cache/quicklatex.com-ffb55ac2334c98f235b920c109802a0e_l3.png "Rendered by QuickLaTeX.com")
(c) For the steady state SDOF damped system at 
![\[ X=\frac{F_0/k}{2\zeta} \]](https://engcourses-uofa.ca/wp-content/ql-cache/quicklatex.com-f3cf4c4e0ed4e538ea85bc97cfcf8114_l3.png "Rendered by QuickLaTeX.com")
![\[ =\frac{F_0m}{2\zeta mk} \]](https://engcourses-uofa.ca/wp-content/ql-cache/quicklatex.com-47b6a34a31df6c68a970312595aafb4f_l3.png "Rendered by QuickLaTeX.com")
![\[ =\frac{F_0}{2\zeta m P^2} \]](https://engcourses-uofa.ca/wp-content/ql-cache/quicklatex.com-11d5fa195052f9e393d280d81789f59a_l3.png "Rendered by QuickLaTeX.com")
![\[ =\frac{F_0}{8\pi^2\zeta mf^2} \]](https://engcourses-uofa.ca/wp-content/ql-cache/quicklatex.com-5e614464181596694eebf67819c7e9a9_l3.png "Rendered by QuickLaTeX.com")
For resonance at the vortex shedding frequency:
![\[ f=\frac{SU}{D} \]](https://engcourses-uofa.ca/wp-content/ql-cache/quicklatex.com-665bcc98777b83edd3722de4a13a0767_l3.png "Rendered by QuickLaTeX.com")
![\[ X=\frac{F_0D^2}{8\pi^2S^2U^2} \]](https://engcourses-uofa.ca/wp-content/ql-cache/quicklatex.com-60b1016b81e0c923ef1331ed2feddeec_l3.png "Rendered by QuickLaTeX.com")
now using:
![\[ F_0=\frac{1}{2}C_L\rho A_fU^2 \]](https://engcourses-uofa.ca/wp-content/ql-cache/quicklatex.com-361f04bf7737a12abadc6ab6f76e27d1_l3.png "Rendered by QuickLaTeX.com")
![\[ X=\frac{C_L\rho A_fD^2}{16\pi^2S^2m\zeta} \]](https://engcourses-uofa.ca/wp-content/ql-cache/quicklatex.com-e62d73529bd1cb1a0b4de1399a933e0b_l3.png "Rendered by QuickLaTeX.com")
at Edmonton altitude

![\[ C_L\approx1.0 \]](https://engcourses-uofa.ca/wp-content/ql-cache/quicklatex.com-e9693f45b3350cd11a858e74824972f1_l3.png "Rendered by QuickLaTeX.com")
![\[ A_f\approx(2.5)(3.6) \]](https://engcourses-uofa.ca/wp-content/ql-cache/quicklatex.com-f1ab95bcc93d7b37819e107a18b7b3e1_l3.png "Rendered by QuickLaTeX.com")
![\[ D\approx3.6 \]](https://engcourses-uofa.ca/wp-content/ql-cache/quicklatex.com-714e0471a4c6f9aa88407617c9df3a08_l3.png "Rendered by QuickLaTeX.com")
Therefore:
![\[ X=\frac{(1.0)(1.0)(2.5)(3.6)^3}{16\pi^2(0.20)^2(6350)(0.0053)}=\underline{\underline{0.432\ \text{m}}} \]](https://engcourses-uofa.ca/wp-content/ql-cache/quicklatex.com-a85359ab830a1a37bda3a7287d5ad977_l3.png "Rendered by QuickLaTeX.com")
Therefore total movement is approximately 1m.
VIBRATION ANALYSIS AND TESTING OF THE COMMONWEALTH GAMES STADIUM SOUND SYSTEM
Original Paper: D.J. Wilson and M.G. Faulkner. Department of Mechanical Engineering. University Of Alberta, Edmonton, Alberta, Canada
ABSTRACT — The possible effects of wind—induced oscillations of the Commonwealth Games Stadium sound system were analyzed before construction. Tests after installation confirmed the original estimates of the system’s damping and natural frequencies.
INTRODUCTION
The Commonwealth Games Stadium sound system is one of the most sophisticated centrally suspended systems ever installed in an open—air athletic stadium. The 6350 kg (14,000 lb) speaker system is suspended above the centre of the playing field by four 110 m (360 ft) bridge strand cables. Figure 1 shows schematically the system and supporting cables. The central location was chosen because of the acoustical advantages of a frontal sound field and the lower power necessary to provide adequate sound pressure levels for all the spectators.
With the structure located 30 m (100 ft) above field level there existed the possibility of wind induced vibrations. While wind tunnel model studies are possible to estimate the magnitude of these vibrations, the relatively simple configuration lent itself to using computations alone. Calculations of the resonant frequencies of the system were combined with the methods outlined in Commentary B of the National Building Code of Canada [1] for estimating wind excitation forces.
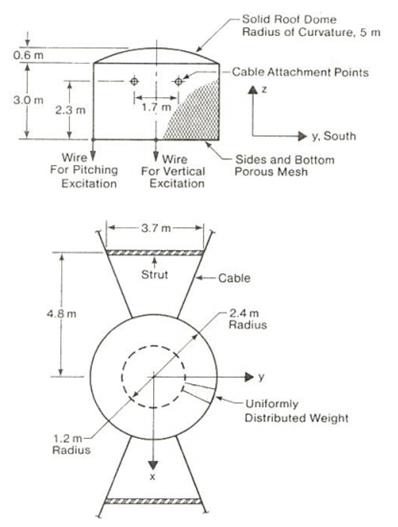
The final design chosen has the speaker cluster enclosed by a 2.5 m (8 ft) radius cylinder 3 m (10 ft) high with a solid dome on the top and an expanded metal mesh on the sides and bottom. In addition struts (shown in Figure 2) were added for stability and to increase certain of the resonant frequencies.
DESIGN CONDITIONS AND ANALYSIS
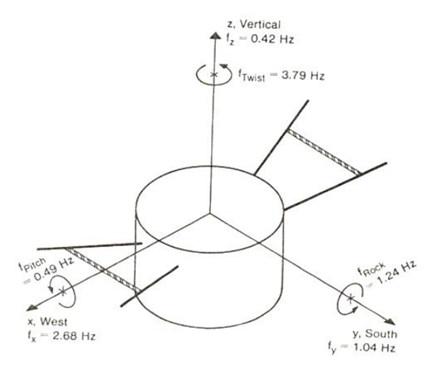
The idealized configuration of the speaker cluster shown in Figure 2 was used for design purposes. From a structural viewpoint this meant a annular cylinder was suspended as shown by four 25 mm (1 inch) diameter bridge strand cables. Because of the symmetry, this structure was assumed to vibrate in any of six modes of vibration (see Figure 3) independently.
From an aerodynamic viewpoint the wind velocities for a 30 year return period were chosen. This is recommended by the National Building Code (NBC) because of the possible hazard to occupants of the Stadium. Based on data in Supplement #1 of the NBC the maximum one hour average wind speed for Edmonton is 90 kph (56 mph) for a 30 year return period. The most severe condition occurs when the holes in the expanded metal mesh covering the structure are open to the wind. The site exposure was taken as urban and an attempt made to account for the influence Of the spectator stands on the wind patterns.
Natural Frequencies of Vibration
The calculated natural frequencies of vibration for each of the six modes are shown in Figure 3. Initial estimates put the level of uncertainty for the translational modes at  10% while the pitching and torsional modes had levels of 25%. The latter uncertainty was due to the difficulty of estimating the mass moment of inertia for the system.
After initial calculations, the compression struts connecting the two easterly cables and the two westerly ones were included to provide additional torsional stiffness. Addition of these struts approximately doubled the frequencies for the torsional, pitching and rocking modes.
Wind Loads
The calculation of the wind loads was done using the procedures recommended in the NBC Commentary B. Two contributions to the wind load, gust buffeting and vortex shedding were considered.
Using the 30 year return wind speed and the wind exposure factors in the NBC gust buffeting loads were computed. Table I shows the parameters related to peak gust buffeting loads. For all wind directions the fluctuation frequency due to gust buffeting is far removed from the resonant frequency resulting in small gust buffeting loads.
Preliminary estimates indicated that vortex shedding would cause the largest deflections and cable loads. For a fixed geometric shape the maximum deflection is related to the aerodynamic and vibration parameters according to the proportionality;
Max. resonant deflection is
![\[ \alpha\frac{C_L(\text{length})^4}{(\text{weight})\cdot\zeta\cdot S_r^2} \]](https://engcourses-uofa.ca/wp-content/ql-cache/quicklatex.com-51aca3d3fa2efd5ec055ea9962ba1a36_l3.png "Rendered by QuickLaTeX.com")
where
 lift coefficient
 damping ratio
 Strouhal number
As seen from the above equation the damping ratio is a most important factor. In the initial design this was taken as 0.01 for vertical oscillation. This damping was assumed to be from aerodynamic sources (0.003) and an equivalent viscous damping of 0.007 from the structure. The values of the lift coefficients and Strouhal number were estimated by a literature survey. The lift coefficient evaluated in this manner should represent an upper limit since limited water channel tests of a sound system model showed no evidence of vortex shedding.
Of the six modes of vibration only vertical motion and a pitching motion about the east-west axis (see axis in Figure 3) had natural frequencies low enough to produce critical airport windspeeds for resonant vibration of less than 160 kph (100mph). Table II shows critical windspeeds equivalent maximum static loads and deflections caused by vortex shedding.
FULL SCALE TESTING
The lack of information on various system parameters caused considerable uncertainty in the design analysis. The estimates of the cable support stiffness, and the damping ratio made the resonant frequency and maximum amplitude calculations suspect. To confirm the previous estimates of these parameters a field test was carried out to directly measure the damping ratio and to confirm the previous estimates for certain of the natural frequencies.
Test Procedure
The damping ratio and natural frequencies were evaluated by using a motion picture camera to record artificially excited vibrations. The film was then projected on a motion analyzer enabling the amplitude, period of oscillation and decay rate to be measured.
The final filming was done with a Cinema Products CP-16 camera with a crystal controlled framing speed and a zoom lens. It was estimated that in conjunction with the motion analyzer the precision and resolution of amplitudes would be 10 mm. The crystal speed control maintained the base accuracy with a variation of only a few parts per million which is negligible for the present application.
Excitation of the system was provided by normally pulling on wires attached to the base of the sound system. One was located under the mass center and pulling on it produced nearly vertical oscillation alone. The other wire was attached at the northern edge of the system. Pulling on this wire produced a combination of pitching about the east-west axis and vertical oscillation. Amplitudes of 300 mm were easily obtained by the manual excitation. The camera recorded approximately 1 minute of decaying vibration after the excitation had ceased.
Data evaluation
The amplitude and period of decaying vibration was measured using a rear projection analyzer. A moveable cross-hair cursor for the projected image allowed a frame by frame analysis of the motion. Time periods between successive maxima were used to evaluate the natural frequency.
The damping ratio was determined by a semi-log plot of the relative amplitudes. The log decrement was evaluated using a best fit straight line (See Figure 4). The fit to a straight line verifies the assumption of equivalent viscous damping. The log decrement is related to the damping ratio by
![\[ \delta=\frac{2\pi\zeta}{\sqrt{1-\zeta^2}} \]](https://engcourses-uofa.ca/wp-content/ql-cache/quicklatex.com-66f5fdea995b79cfa15228d2c901e4b4_l3.png "Rendered by QuickLaTeX.com")
![\[ \zeta = 0.0054 \]](https://engcourses-uofa.ca/wp-content/ql-cache/quicklatex.com-c0da2c752af98bfbaf57f0504f2cdcb7_l3.png "Rendered by QuickLaTeX.com")
10%.
For the pitching mode, a beat formed between the vertical and pitching modes made it impossible to measure the damping in the pitching mode. The natural frequency however could be evaluated. A comparison between the measured and predicted values is shown in Table III.
CONCLUDING REMARKS
The results of the initial design analysis and the results of field testing shown in Cables i, ii, and iii show good agreement. The damping ratio originally estimated at 0.01 compares to the sum of measured values of 0.0054 and calculated aerodynamic damping of 0.0031 (total of 0.0085). The measured and calculated natural frequencies for the vertical and pitching modes are within 10-15% of those measured. Of the six modes of vibration these two are the only ones which could occur at airport wind speeds of under 160 kph.
The system has been in place nearly two years and while some deflections have been observed these have not approached the maximum predicted leading one to believe that estimates of the increased loads and deflections were quite conservative.
ACKNOWLEDGEMENTS
The authors would like to thank Ragan, Bell, McManus Consultants Ltd. for suggesting our involvement in this project. In particular we would like to mention Stan Ragan and Dan O’Brien.
REFERENCES
[1] National Building Code of Canada 1977 NRCC No. 15555 including Supplement No. 1 NRCC No. 15556 and Supplement No. 4 NRCC No. 15558
Table I: Gust Buffeting at 90 KPH Design Hourly Airport Windspeed (30 Year Return)
| Wind Direction | Max 5 sec Gust on System (KPH)MPH | Total System Damping | Max Gust Load kN | Max Deflection mm | System Natural Frequency Hz | Fluctuation Frequency Hz |
| North or South | (132)82 | 0.0073 | 11.7 | 4.0 | 1.04 | 0.24 |
| East of West | (85)53 | 0.0058 | 4.8 | 2.5 | 2.68 | 0.68 |
Table II: Vibration Induced by Vortex Shedding
| Direction of Motion | Natural Frequency Hz | Critical Airport Windspeed, North or South Direction (KPH)MPH | Critical Airport Windspeed, East or West Direction (KPH)MPH | Critical Windspeed at System (KPH)MPH | Maximum Equivalent Static Load kN | Half Amplitude mm |
| Vertical Z | 0.48 | (63)39 | (135)84 | (53)33 | 38 | 795 |
| Pitching about X-(West) Axis | 0.53 | (69)43 | (150)93 | (58)36 | unknown | unknown |
Table III: Comparison of Measured and Computed Resonant Frequencies
| Direction of Motion | Computed  , Hz , Hz | Measured , Hz |  |
| Vertical Translation along Z axis | 0.42 | 0.48 | 1.14 |
| Pitchings: Rotation about X-West axis | 0.49 | 0.53 | 1.08 |