Biomechanics and Bioengineering of Orthopaedics: Fatigue as a failure mode
This section introduces the fatigue failure mode for bone and fixation devices.
Stress concentration
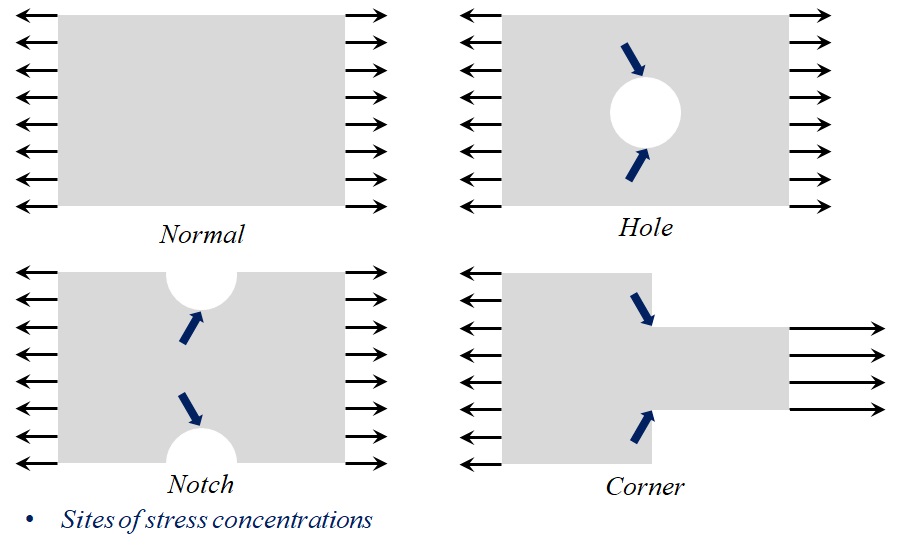
Geometric irregularities within a structure, such as holes and sudden changes in the cross-section, are called stress raisers (Fig. 5-1).
When a structure is subjected to normal loads, a higher amount of stress occurs at these locations, in comparison with other points in the structure. This phenomenon is called stress concentration and it happens for two reasons:
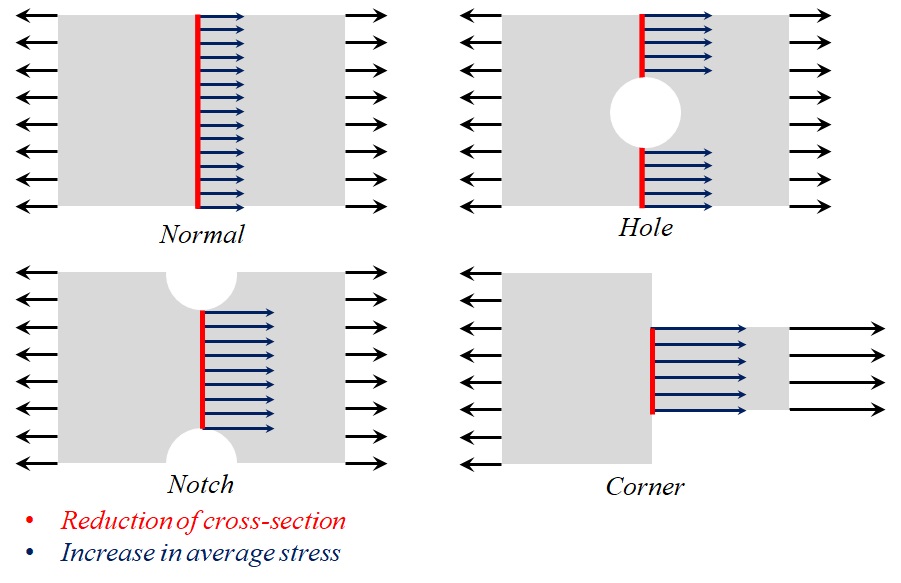
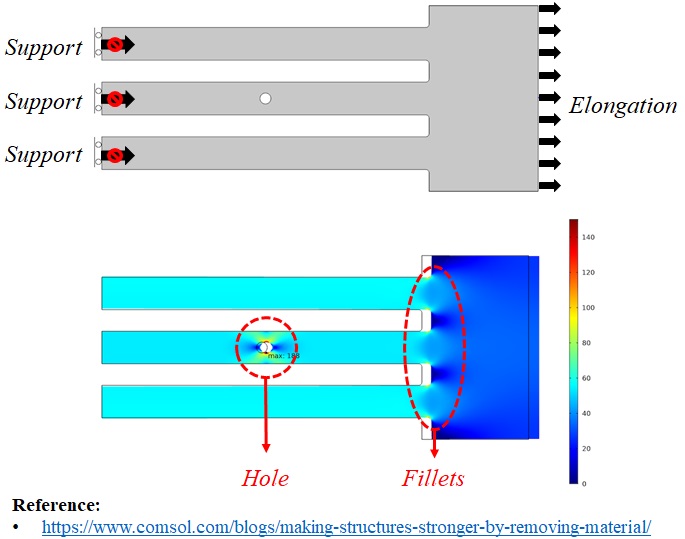
First, the cross-section is reduced at the locations of stress raisers, which means higher stresses are induced in these areas (Fig. 5-2).
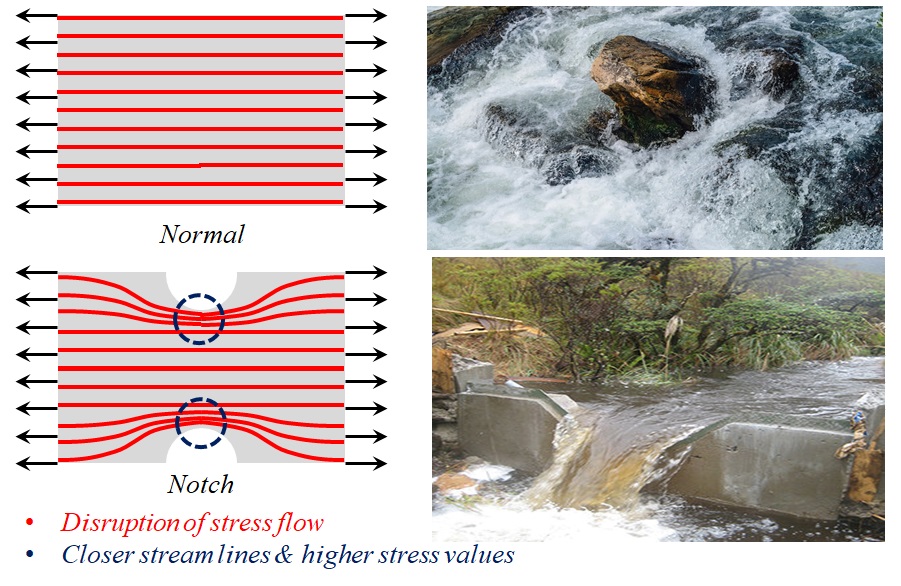
Second, the stress raisers interrupt the stress flow within the structure, which leads to a higher stress amount at some locations, similar to a rock in a river, causing turbulence (Fig. 5-3).
Consider a structure with three bars, which is supported at the left end and elongates at the right end (Fig. 5-4). When the displacement is applied at the right end, the stress magnitude is highest at the top and bottom of the hole in the middle bar, and the stress values at the fillets are also considerably higher in comparison with other points.
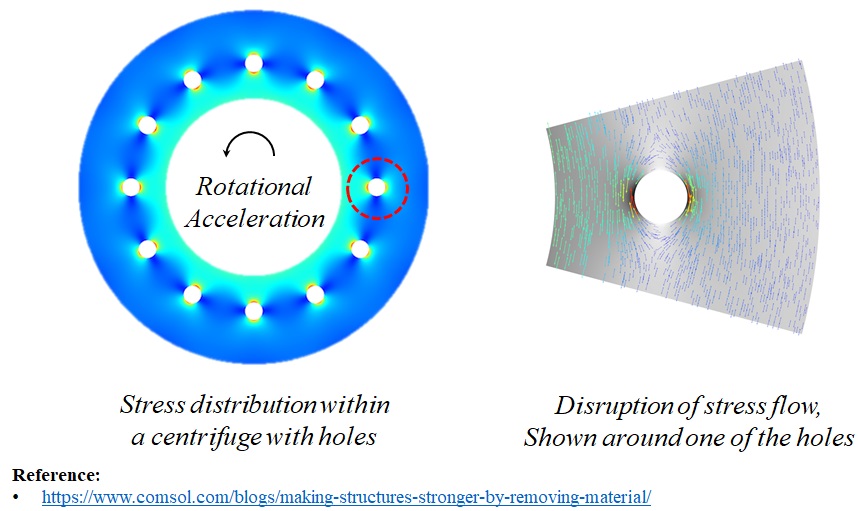
Here’s another example, that shows the stress distribution within a centrifuge under a rotational acceleration, with stress concentration around the holes (Fig. 5-5). The stress flow is interrupted near the holes, resulting in a higher amount of stress.
Fatigue
When a structure is subjected to loading which varies with time, sometimes, it fails at stresses below the material’s ultimate strength, this phenomenon is called fatigue failure.
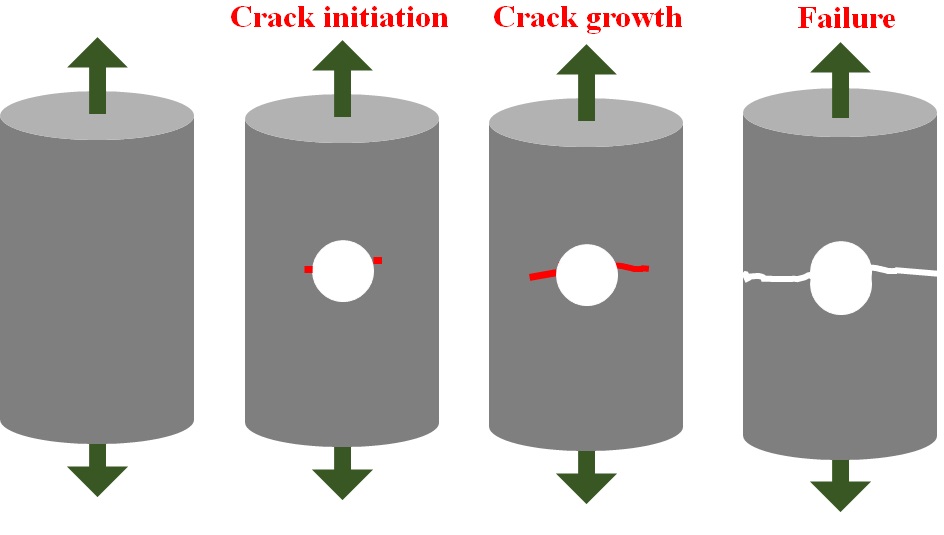
Fatigue failure occurs due to the formation and propagation of cracks. It has three stages (Fig. 5-6). The first stage is crack initiation. This usually happens at free surfaces due to stress concentration. In the second stage, the crack propagates in size. In the final stage, after the crack propagates to a critical size, the fracture happens and the structure fails.
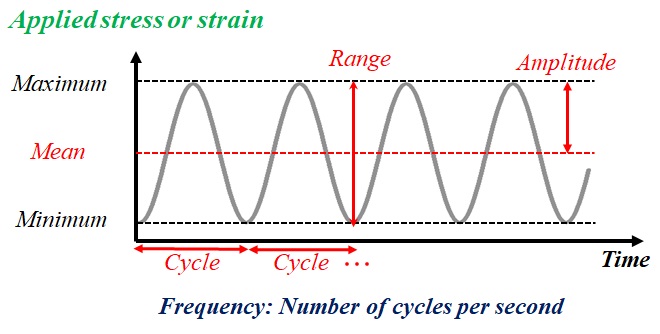
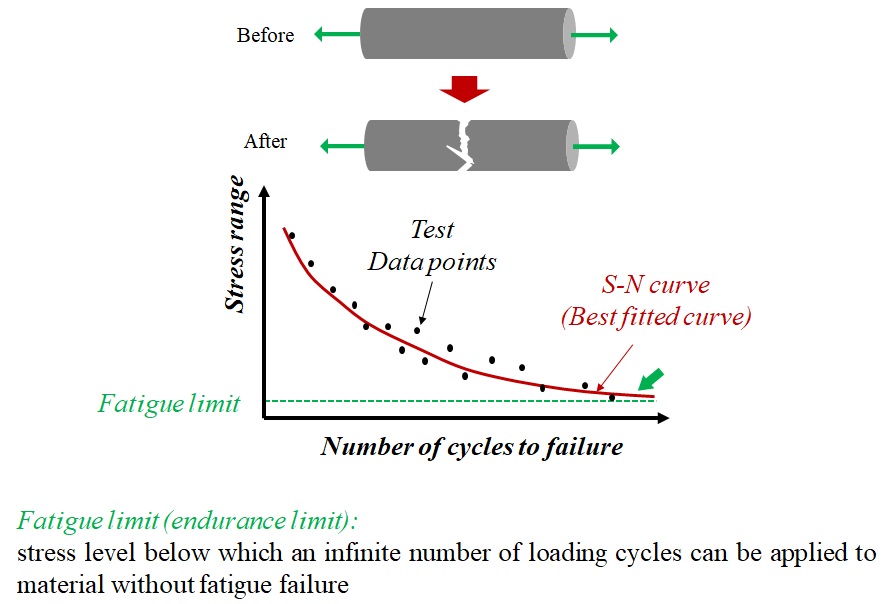
Cyclic loading is a repeated pattern of stress or strain, applied to a specimen or a structure (Fig. 5-7). The difference between the maximum and minimum applied stresses defines the stress range. The stress amplitude is defined as half of the range. The mean stress is the average of the maximum and minimum stresses. The cycles of loading are usually modeled as sinusoids, but they could be composed of lines and other patterns as well. The frequency of a load is the number of cycles during one second.
To understand the fatigue behavior of a material, various specimens of the material are subjected to cyclic loading with different stress ranges. In each experiment, a specific stress range is applied to a specimen and the stress range is plotted with respect to the number of cycles before failure. By fitting a curve to the test data points, we get a curve, which is called the S-N curve (Fig. 5-8). The S-N curve is a measurement of the fatigue behavior of the material. For some materials, this curve at a very large number of cycles becomes a horizontal line. The corresponding stress range is called fatigue limit or endurance limit.
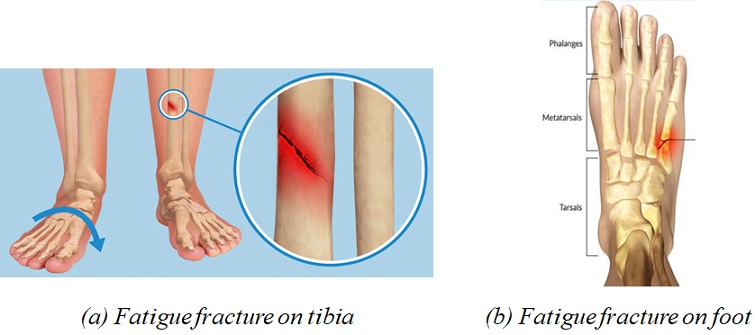
Stress fracture is the fatigue failure of bone due to repetitive forces, such as repeatedly jumping up and down or running long distances. It is also called fatigue fracture or overuse fracture. This type of fracture is composed of tiny cracks, due to abnormal stresses, applied to a normal bone. This fracture is common in the weight-bearing bones of the lower leg and foot (Fig. 5-9). Track and field athletes and military recruits who carry heavy packs over long distances are at the highest risk. Stress fractures of the tibia are common injuries in sports, caused by long-time running like marathons, basketball, and soccer.
Fatigue failure is a serious issue affecting the durability of orthopedic implants as well. The fatigue strength of the bone-implant system depends on many factors.
The material used in the implant device and its mechanical properties play a crucial role in the fatigue strength of the bone-implant complex. Stainless steel and titanium are two common materials used in manufacturing fixation devices. Young’s modulus of both these materials is an order higher than those of the cortical and cancellous bone tissues, especially Young’s modulus of stainless steel. This mismatch of Young’s moduli between the bone and fixation device, sometimes, results in poor load transfer from the implant to the bone and is a major contributor to fatigue failure.
The notch sensitivity of a material is a measurement of material strength reduction, caused by the presence of a notch or other stress raisers. This mechanical property is higher for titanium which makes this material less resistant to crack development, compared to steel.
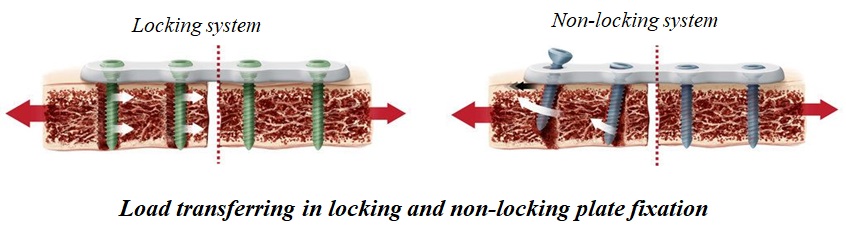
Geometrical features of an implant device, such as the usage of locking or non-locking plates, the number of screws used within the device, and the specifications of the screw also affect the stress distribution within the bone-construct system and its durability.
The contact area between the bone and the construct is minimal in locking systems, which might cause stress concentration when loads are transferred from the bone to the fixation device through the screws (Fig. 5-10).
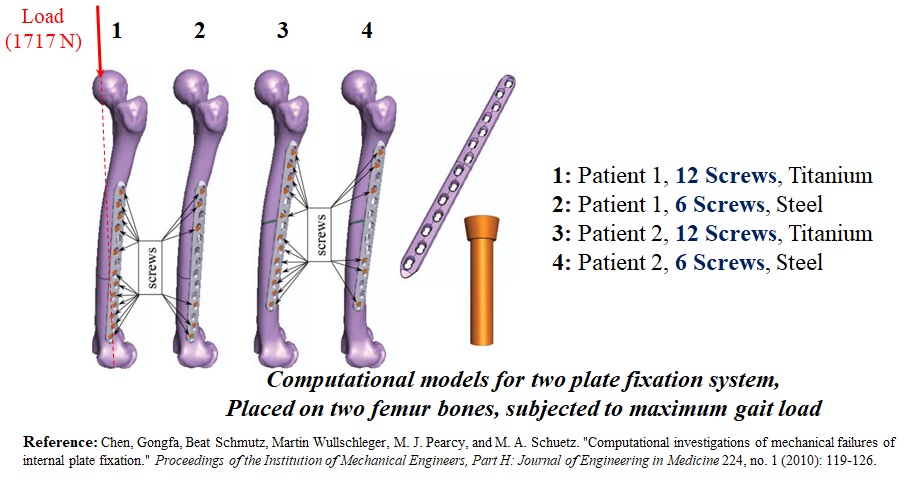
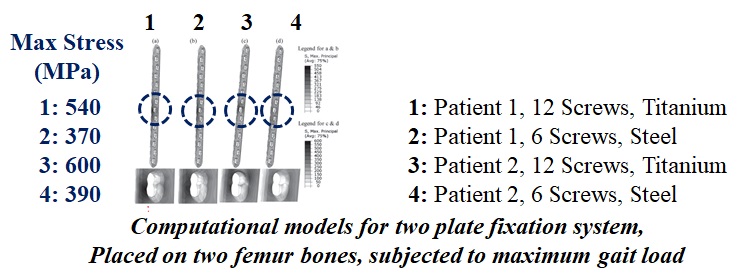
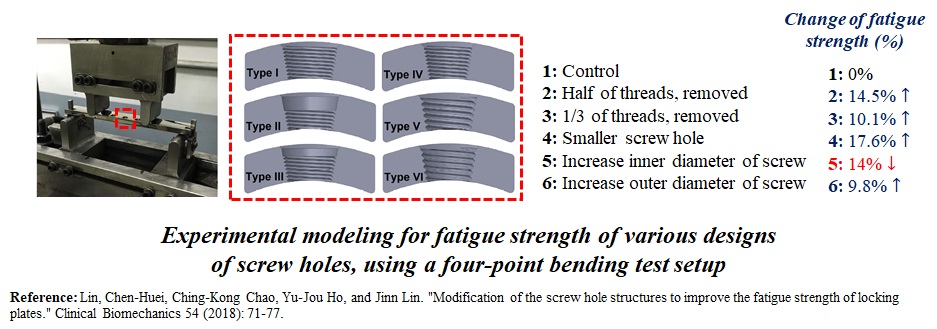
The arrangement of screws is another key factor. Using a larger number of screws might result in a rigid fixator that has a higher stress concentration and a higher risk of fatigue fracture. It is also shown that the geometrical features of the screw such as the length of the threaded section, the screw size, and the inner and outer diameter of the screw affect the fatigue strength of the bone-implant system.
To understand the fatigue behavior of the implant devices, researchers investigated orthopedic implants under cyclic loads through computational and experimental modeling (Fig. 5-11, 12 and 13).
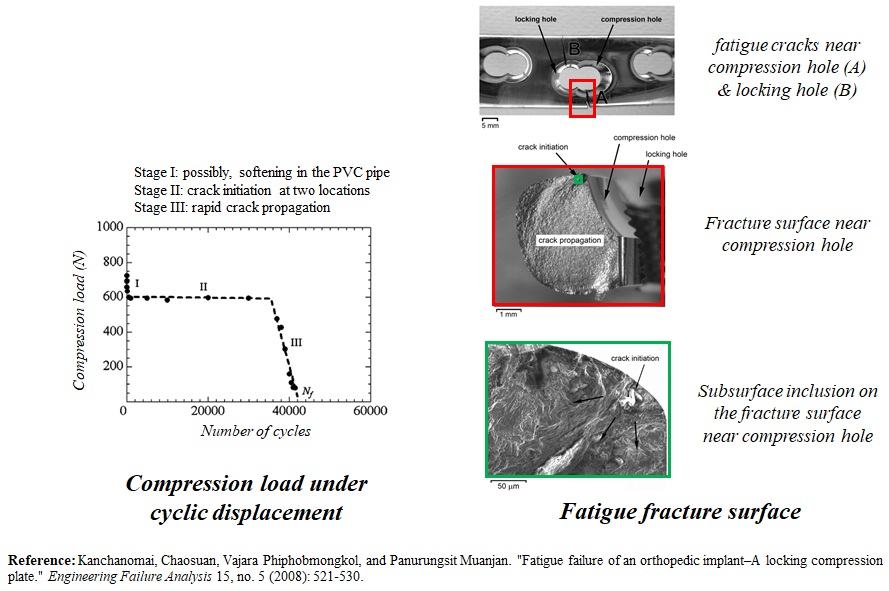
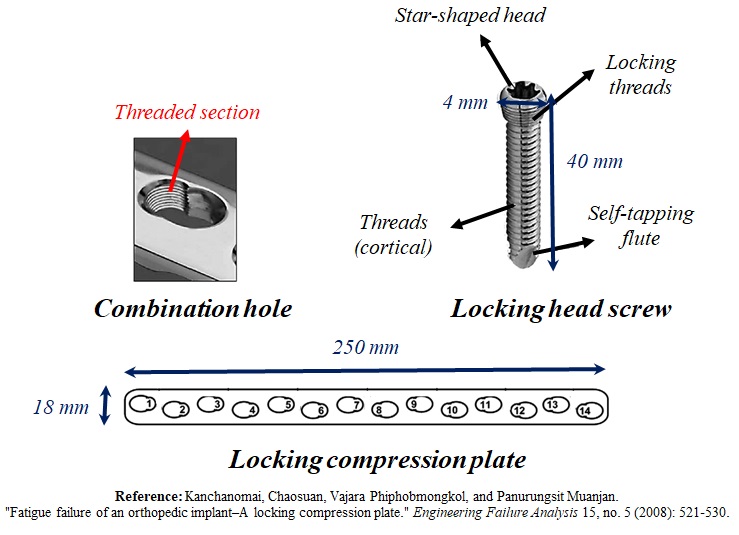
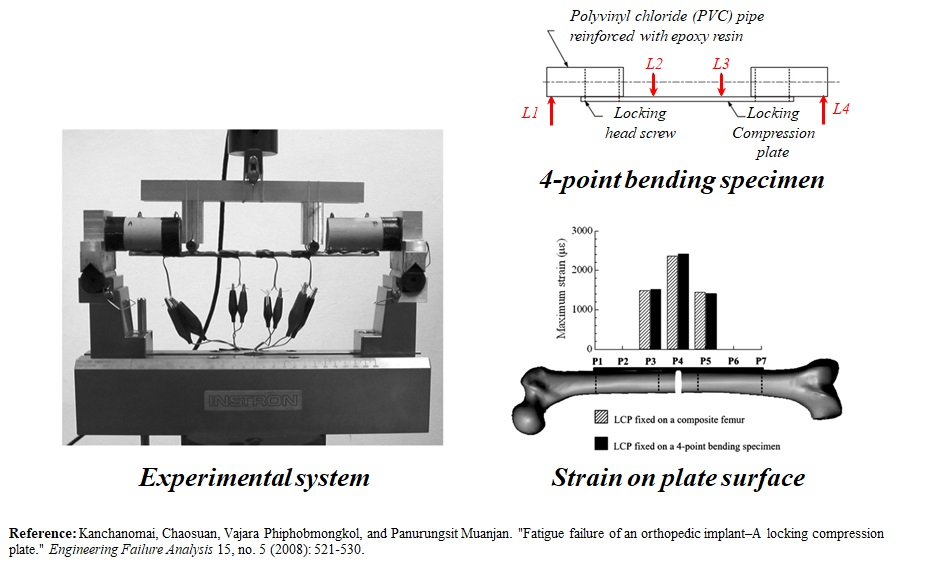
In an experimental study on the fatigue failure of orthopedic implants, a locking compression plating system with combination holes was tested for failure due to walking (Fig. 5-14). A combination hole allows the insertion of locking head screws through the threaded section.
The plating system was first fixated, through the locking holes, to a specific composite femur model with a transverse diaphyseal fracture. Using a servo-hydraulic machine, a monotonic load was applied to the composite femur-plate system (Fig. 5-15).
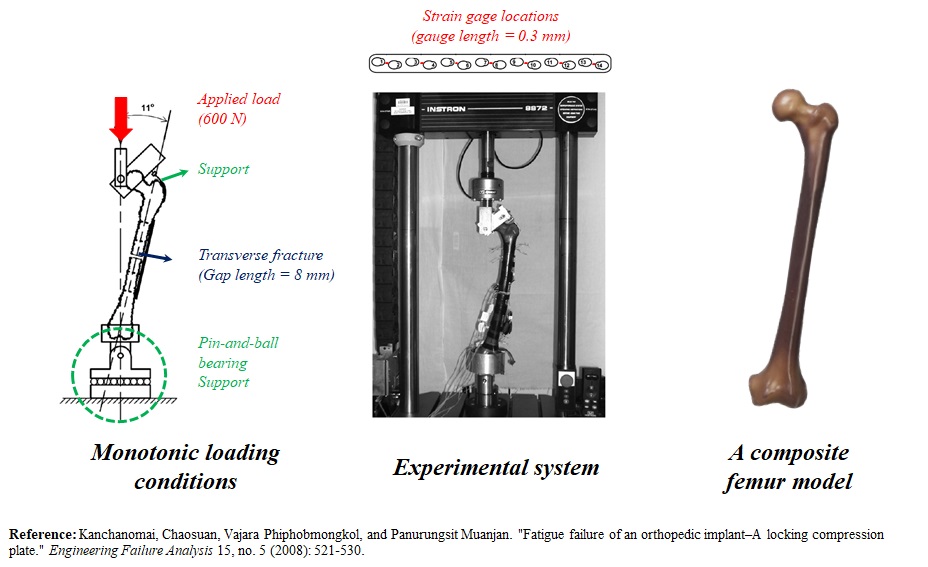
Seven strain gages were installed on the plate, and maximum strain values at different locations on the plate were recorded when the full walking load was applied (Fig. 5-16). Since the composite femur could not be subjected to cyclic loads, for the fatigue test, the plating system was fixated to two solid polyurethane foam pipes and tested by a 4-point bending test machine (Fig. 5-16).
The fatigue test was conducted by applying displacement. The location and the displacement magnitude of the test rollers were adjusted such that, the maximum strain, distributed on the surface of the plate, matches the strain distribution obtained from the monotonic test. The cyclic load pattern was sinusoidal and its frequency was 3 hertz. For each cycle, the compression load was recorded by the machine (Fig. 5-16).
The behavior of the structure under cyclic load consists of three stages (Fig. 5-17). In the first stage, a rapid decrease in the compression load occurred, possibly due to the rapid softening of the solid pipes.
In the second stage, the compression loads remain constant for a large number of cycles. The crack was initiated at this stage. The cracks begin from a subsurface inclusion, embedded near the compression hole, and then another crack formed at the surface of the locking hole.
In the last stage, the compression load quickly decreases due to the rapid propagation of the cracks, and the structure failed.