
Introduction to Engineering Economics: A Brief Guide to Engineering Financial Calculations
Introduction
This document provides concise explanations of the financial calculations covered in lectures of ENGM 401. This document provides brief context of the analysis scenario where each method applies.
Introduction to Financial Statements
Financial statements document the answers to three key questions about a business:
- How much did we make, and how much do we keep?
- How much do we have, and where did it come from?
- Where did our money go?
There are four types of financial statements:
- Income statements
- Balance sheets
- Cash flow statements
- Statement of retained earnings.
Financial statements are part of a chain that turns data into information analyzed in context for informed business decision making:
- Bookkeeping tracks all the transactions in a company
- Accounting assembles all the entries into different financial statements
- Analysis consists of interpreting Financial Statements.
Chronological journal entries are transferred to ledgers, which are the books of final entry, in the following categories:
- Assets
- Liabilities
- Equity (also called shareholders’/owners’ equity or capital)
- Revenues
- Expenses
Double-Entry Accounting
Double-entry accounting tracks transactions by where the money comes from, and where it goes. There are two types of transaction entries, debits and credits.
Debits:
- An increase in an asset account
- A decrease in a liability account
- A decrease in an equity account
- A decrease in a revenue account
- An increase in an expense account
Credits:
- A decrease in an asset account
- An increase in a liability account
- An increase in an equity account
- An increase in a revenue account
- A decrease in an expense account
The process for doing double-entry bookkeeping is as follows:
- Figure out what the two halves of the transaction are
- Decide for each part of the transaction, whether it makes each account go up or down
- Check to make sure that one is a credit and the other is a debit.
The trick category is assets. The simple way to think about when an asset account goes up it is a debit is to remember that to make that account go up you had to use some money to do it (a use of funds). Conversely, when an asset account goes down, it is freeing up some money.
The Income Statement & Contribution Margin
Key Assumptions
In this course, unless otherwise stated, the Income Statement is considered to be a financial statement of earnings before interest and taxes, which is of particular interest to operations managers. Cost accounting allocates costs according to categories that relate to whether the cost is directly related to production or indirectly related overhead. How indirect costs are allocated to a product can give a clear (or distorted) picture of the overall cost of a product.
There is an alternative accounting method called activity-based accounting. This method links each activity that the organization does to specific cost drivers (e.g., machining, transportation, procurement, engineering,…), and tries to minimize the amount of overhead charges. This method of accounting can be more accurate, but it requires care in budgeting and cost tracking. Activity-based accounting is not covered in this course.
Revenue is the money that comes into the company through sales of its goods or services.
Costs directly related to production are generally included in the category of Cost of Goods Sold (COGS).
Costs that are not directly related to production are generally listed under the category of Sales General & Administrative (SG&A). Depreciation is an element of the expenses that are included within SG&A. The depreciation is a non-cash expense that represents the loss in asset value during the reporting period. The other charges against income that are non-cash charges are:
- Allowances for future costs.
- Allowances for reclamation.
These would also go into cash from operations. We do not usually consider these allowances in most of our work.
Other Income includes one-time revenues and expenses such as writedowns. In some companies, the interest on the long-term debt is also included within Other Income.
Contribution margin represents the value that has been created above what is necessary to cover direct costs; that value can cover the indirect costs and, with Other Income, (hopefully) create profit (also called earnings). In this part of the course we are dealing with how an operation generates earnings, which may be for a part of a company. For this reason, we consider the earnings before paying any interest expenses for borrowed money, or taxes. This is an advantage when considering the CM of different product lines.
When a new opportunity for a company appears, and the indirect costs have already been covered, then the profit of that incremental is very high. This is because there are little to no indirect costs associated with the extra revenue. That means that such work can be discounted to some extent, and still make a profit (provided that all of the direct costs are covered, of course).
Calculations
Net Revenue = Gross Revenue – (Bad debt, warranty, and allowances)
Contribution Margin = Net Revenue – COGS
Contribution Margin (%) = (Net Revenue – COGS) / Gross Revenue
Operating Income = Contribution Margin – SG&A (including Depreciation). (Operating Income is usually calculated before considering any taxes.)
Net Income = Operating Income + Other Income.
Net Income is also called Profit or Earnings. If Net Income is negative it is a Loss. Remember, the definition of Net Income used here is the same as Earnings before Interest or taxes (EBIT). Later in the course we will consider Net Income for an entire company, including costs of financing (interest) and income taxes.
Quick checks in the Income Statement to assess whether there is enough cash being generated to run the operation are: Cash Flow from Operations, and Net Cash Flow.
Cash Flow from Operations = Operating Income + Depreciation. (typically)
= Contribution Margin – SG&A (excluding depreciation)
Net Cash Flow = Net Income + Depreciation + Writedowns. (typically)
Net Cash Flow is also called Total Cash Flow. Here we have assumed that the only Other Income is writedowns.
Cash break-even is when operating income (with any any non-cash expenses such as depreciation having been added back in) is zero. Book break-even is when operating income is zero without having to add depreciation back in (that is, when the non-cash expense is subtracted). Cash break-even thus occurs at a lower operating income than book break-even. Cash breakeven means that you aren’t making a profit, but at least you are not losing money in the short term. Book breakeven means that not only can you cover your costs, but also you replace assets if necessary. Cash breakeven point can be simply calculated from:
Simple cash breakeven point = SG&A / (Net Revenue – COGS)
Production
Production over an interval of time is the product of: the nominal rate of production, the duty (which is the fraction of the nominal production rate that is actually achieved, the utilization (the fraction of the time that production actually occurs), and the time interval:

This formula assumes that the nominal production rate is a good representation of the average production rate. In many cases this is a reasonable assumption; but in some industries the production rate varies considerably, due to the batch nature of production or other influences.
Depreciation
Depreciation is a non-cash expense that represents the need to replace assets eventually as they wear out. It is an accounting line item that tracks an estimate of how much asset value has been lost during the reporting period. Different types of assets have different rates at which they lose value. This decline in value is not always linear, because some assets lose value faster earlier in their life, and some assets hold most of their value early but then lose value faster later on. Some assets have residual value at the end of their useful life, called salvage value. Book value is whatever the value of the asset is estimated to be at that time (purchase price minus accumulated depreciation). Depreciation of intangible assets is also called amortization.
Key Assumptions
Unless otherwise stated, the fiscal year for a company is the calendar year.
The useful life of the asset is estimated to be  years. The depreciation amount in the first year is adjusted if the asset is purchased in the middle of the year.
The Book Value for year  is,
is,  and it can not be less than the Salvage Value
  .
.
Calculations
Straight-Line Method:
The depreciation amount for each full year is the same amount: the original value of the asset  minus the salvage value all divided by the number of years
![\[d_t = \frac{B-S}{N}\]](https://engcourses-uofa.ca/wp-content/ql-cache/quicklatex.com-2c8b617207909eb7a7666b1b06ee38f4_l3.png "Rendered by QuickLaTeX.com")
The Book Value at the end of year is the original book value minus the sum of the accumulated depreciation amounts.
Sum-of-Years-Digits Method:
The depreciation amount is different for each year (where starts at 1 and goes to ):
![\[d_t = \frac{N-t+1}{SOYD}*(B-S)\]](https://engcourses-uofa.ca/wp-content/ql-cache/quicklatex.com-c8dbf07ccb94a00ffac51672622cc76b_l3.png "Rendered by QuickLaTeX.com")
The Book Value at the end of year is the original book value minus the sum of the accumulated depreciation amounts.
Declining Balance Method:
The depreciation amount in a given year depends on a depreciation rate  multiplied by the Book Value for the previous year (which in the first year is the original value ).
![\[d_t = D * BV_{t-1}\]](https://engcourses-uofa.ca/wp-content/ql-cache/quicklatex.com-e4bcdbdfc5c9fec08f8938945b762742_l3.png "Rendered by QuickLaTeX.com")
where the Book Value at the end of year is the original book value minus the sum of the accumulated depreciation amounts:
![\[BV_t = B * (1-D)^t\]](https://engcourses-uofa.ca/wp-content/ql-cache/quicklatex.com-90c3627c0694d17c983bbff9f764fbd5_l3.png "Rendered by QuickLaTeX.com")
thus we can directly write
![\[d_t = D * B * (1-D)^{t-1}\]](https://engcourses-uofa.ca/wp-content/ql-cache/quicklatex.com-22141e2548d758cc02ffc4099840ad1c_l3.png "Rendered by QuickLaTeX.com")
Note that this method does not explicitly use an estimate of the useful life of years or salvage value , but the rule still applies that can not be less than .
Double Declining Balance Method:
This is a special case of the declining balance method, where a useful life is defined, from which the depreciation rate is set to be  .
.
Units of Production Method:
The depreciation amount in a given year depends on the actual production  and the total lifetime production
  over the useful life of years. The units of production will be in terms of the production method, such as tonnes of oilsand moved by a haul truck, number of widgets stamped out by a press, etc.
The Book Value at the end of year is the original book value minus the sum of the accumulated depreciation amounts:
![\[d_t = \frac{P_t}{P_{lifetime}}*(B-S)\]](https://engcourses-uofa.ca/wp-content/ql-cache/quicklatex.com-9f0eb4c16328ba82c7780bdb37f8f226_l3.png "Rendered by QuickLaTeX.com")
For Assets Purchased Midway through a Year:
When an asset is purchased in the middle of a year, depreciation is prorated in that year. The calculation method is as follows:
1) Calculate the nominal annual depreciation for the first year using the chosen method (straight-line, SOYD, etc).
2) Book 1/12 of the nominal first-year depreciation amount per month on a straight-line basis for the remainder of the year, booking the first depreciation at the end of the month in which the asset was purchased. For example, a purchase in April entails nine depreciation amounts for the remainder of the year (end of April, end of May,…, end of December). Note that when an asset is purchased midyear, the nominal salvage value is not actually achieved at the end of the  year after the purchase.
Depreciation for Tax Purposes: Capital Cost Allowance
Capital cost allowance is calculated based on declining balance. When calculating capital cost allowance for year ( ) and the unclaimed capital allowance (
 ), group assets by their taxation class and use the appropriate rate for each class. The sum of transactions for year is
  ; an asset transaction is positive for purchase of an asset & negative for a sale of an asset. The CCA is not affected by when the assets are purchased during the tax year.
For each class of asset, the calculation procedure is:
| Find , which is the sum of the transactions for the current year |
| If > 0, then * = 0.5 ; otherwise * = (50 % rule) |
Calculate =  * ( * ( + *) + *) |
| Calculate = + – |
The Book Value at the end of year is the original book value minus the sum of the accumulated depreciation amounts.
Historically, companies have most often used one of two methods:
straight-line, or double-declining balance.
The Balance Sheet, Working Capital, and Leverage
Working Capital
Key Assumptions:
A short-term lender may put conditions (covenants) on a company requiring it to have a certain amount of Working Capital, or more than a certain Working Capital Ratio, which are calculated from figures on the balance sheet. A low Working Capital Ratio is an indication that the company may have trouble dealing with swings in short-term expenditures.
Calculations:
Working Capital = Current Assets – Current Liabilities.
Working Capital Ratio = Current Assets / Current Liabilities
Leverage
Most companies require financing. This is done either through equity (money from owners) or debt (money from others). Interest is the cost of debt. A company usually has a mix of both kinds of financing.
In good times, the earning power of the investment is higher than the cost of debt (i.e., interest on the Bank Debt). In that case, the extra value that has been created gets transferred to Equity, thus increasing the Return on Equity.
In bad times, the interest on the debt portion is higher than the earning power of the investment; and so the Return on Equity gets reduced to cover the shortfall. (A negative Return on Equity means that the owners are losing money.)
Key Assumptions
A number of methods can be used to calculate leverage. In this course, we consider the leverage between Bank Debt (a type of long-term debt) and Equity.
For leverage analysis, we assume Net Income to be the Operating Income minus the interest on the long-term debt (found on the Income Statement). (This is consistent with including interest on long-term debt as a negative entry in Other Income.)
- Bank Debt is found on the Balance Sheet, usually named Long-Term Debt.
- Total Assets and Total Equity are also found on the Balance Sheet.
- The bank interest rate is given information.
Calculations
Three sets of calculations are made: leverage, net income, and return on equity.
Bank Debt Leverage = Bank Debt / Total Assets (expressed in percent).
or
Debt Ratio Leverage = Total Liabilities / Total Assets (in percent)
Net Income = Operating Income – (interest rate) x(Bank Debt)
Return on Equity = Net Income / Total Equity. (expressed in percent)
(Here, net income is defined as operating income minus interest paid. This is appropriate for assessing a division of a company, but generally not for the entire company. In reality, an investor would look at Return on Equity for the whole company on after-tax earnings, in which case we use After-Tax Net Income in the calculation. We’ll consider this briefly in the project and in some detail later in the course.)
Cash Flow Statement
A business must have access to liquid funds (“cash”) to pay its day-to-day expenses. The statement of cash flow looks at the non-cash accounts to determine the overall flow of cash in and out of a company during a reporting period.
Key Assumptions
Sources and Uses of Funds:
Sources and Uses of funds are enumerated from two successive Balance Sheets and the Income Statement for the period between them.
- For Asset accounts, an increase is a use of funds; a decrease is a source of funds.
- For Liability accounts, an increase is a source of funds; a decrease is a use of funds.
- For Equity accounts, an increase is a source of funds; a decrease is a use of funds.
On the Statement of Cash Flow, a source of funds is entered as a positive number; and a use of funds is entered as a negative number. This is potentially confusing for asset accounts, where an increase is entered as a negative number.
The short-term credit line (STCL) can be thought of as “negative cash.”
Depreciation is always considered to be a source of funds. So are other non-cash expenses.
Non-Cash Working Capital:
Non-cash working capital is the sum of current assets except cash minus the sum of current liabilities except the short-term credit-line and the current portion of the long-term debt.
Non-cash working capital
= (total current assets – cash)
– (total current liabilities – STCL – current portion of long-term debt).
Non-cash working capital is the year-over-year difference in current assets (except cash) and year-over-year difference in current liabilities, with the exception of: short term debt, and the current portion of long-term debt (which is financing).
Change in non-cash working capital
= [( –
–  )
)
– ( –
–  –
–  )]
)]
– [( –
–  )
)
– ( –
–  –
–  )]
)]
where the subscript e indicates the value at the end of the reporting period and subscript s indicates the start of the reporting period.
The change in non-cash working capital is also easily tallied from the Statement of Cash Flow. If an asset account has increased during the period, then the change is a use of cash; and so the value of the change in that account would be a negative number. If a liability account has increased over the period, then the change is a source of cash; and so the value of the change in that account is a positive number.
For a typical Statement of Cash Flow, the change in non-cash working capital is the sum of sources/uses of cash from these six accounts: receivables, inventory, prepaids, accounts payable, accrued expenses, taxes payable.
Cash (including “negative cash”) is excluded here because it’s what we balance everything with later as Net Cash (also called the Funds Flow) during the reporting period, where
Net Cash = Cash – STCL
Calculations
The Statement of Cash Flow has three sections: Operating Activities, Investing Activities, and Financing Activities. The totals for these activities sum to the change in net cash over the period.
Operating Activities (OA):
- Enter Net Income for the period from the Income Statement (not retained earnings).
- Add back in depreciation and any other non-cash charge (as sources of funds).
- Add (or subtract if appropriate) the changes in non-cash working capital.
- Total these entries.
Investing Activities (IA):
- Enter any additions or removal of asset acquisition costs (if new assets are purchased, then the asset account increases, which is a use of funds, so the value is negative).
- Enter the gain or loss on sale of shares or investments in other companies (Goodwill and intangibles). (Again, if new assets are purchased, then the value is negative.)
- Total these entries.
Financing Activities (FA):
- Enter any new equity injection (an increase in shares would be a source of equity funds) or any withdrawal (a use of equity funds).
- Add any new long term borrowing that has occurred (a source of funds) or subtract repayment (a use of funds).
- Subtract dividends paid (a dividend is a use of equity funds).
- Total these entries.
Change in Net Cash:
Operating Activities plus Investing Activities plus Financing Activities equals the change in net cash during the period:
Change in Net Cash = OA + IA + FA.
Change in Net Cash is also called the Funds Flow during the reporting period. Funds Flow is the Change in Cash Position from the start of the period to the end of the period, which equals the change in the sum of cash minus the amount of the short-term credit line.
A check can thus be made on the change in Net Cash calculation. Net cash at a point in time is cash minus the amount of the STCL (information found on the balance sheet). The balance sheet at the time when the reporting period starts tells you the net cash as of the start of the period: cash minus the amount of STCL. Similarly, net cash at the end of the period is found from the balance sheet at the time of the end of the period. That means that the Funds Flow (the sum of OA + FA + IA) will equal the change (from the beginning to the end of the period) of the sum of cash minus the amount of the short-term credit line.
If the change in net cash is negative, the flow of funds is into the company, meaning that sources of cash had be available to the company during the period to support its operations (the cash account going down is a source of cash, just as an increase in the STCL is a source of cash). More cash is being used by the company than it produces. This is not a happy situation if it persists too long. If the change in net cash is positive, then funds flow is outward. There are uses of cash and/or of the STCL coming out of the company during the period; this means that the company was able to support its activities without having to find more cash from outside.
Financial Ratios
Financial ratios extract information from the statements that relate to operational and financial performance, and, from market information, how investors might assess the value of a company’s stock. There are five Classes of Ratios.
Liquidity Ratios are financial ratios that measure the likelihood that a business will remain solvent in the short term (e.g. Current Ratio, Quick or Acid Test Ratio). Will the company stay solvent in the short term?
Activity Ratios are financial ratios that measure how effectively assets are being used in the business (e.g. Inventory Turnover, Average Collection Period, Fixed Asset Turnover, Total Asset Turnover). Also called Asset Management Ratios or Efficiency Ratios. Is management making good use of the company’s assets?
Leverage Ratios are financial ratios that measure how effectively a business is likely to repay its total debt (e.g. Debt Ratio, Times Interest Earned, Fixed Charge Coverage). Also called Debt Management Ratios. Will the business be able to service the debt it has undertaken, paying both interest and principal?
Profitability Ratios: Financial ratios that measure the profitability of the business (e.g. Profit Margin on Sales, Return on Total Assets, Return on Equity). Is the company earning enough on the assets or equity that has been given to the business?
Market Value Ratios are financial ratios that measure stock price against earnings and book value of equity (e.g. Price/Earnings, Market/Book). For publicly traded companies, how does the stock value compare to earnings and the book value of assets?
A single ratio does not give a complete picture of the operational and financial situation of a company.
There are at least four uses of financial ratios:
Trend analysis (internal and external), an examination of ratios over time, which tries to determine whether the ratio is changing in a favourable or unfavourable direction;
Comparison to industry averages (internal and external), where industry average ratios provide a benchmark for comparison, if a ratio is too far from the industry average, something may be wrong;
Setting and evaluating company goals (internal), as company goals are often stated in terms of financial ratios (for example, it is common for management to set goals regarding the firm’s ROE);
Restrictive debt covenants (external), for example, a borrower might be required to maintain a debt to equity ratio of less than 1.0 and a current ratio greater than 2.0
Summary List of Comparative Ratios
Liquidity Ratios: Measures of the likelihood that a business will remain solvent in the short term.
Current Ratio: Current Assets divided by Current Liabilities.
Quick Ratio or Acid Test: (Current Assets minus Inventories) divided by Current Liabilities.
Activity Ratios (Also Called Asset Management Ratios): Measures of how effectively assets are being used in the business.
Average Collection Period: See Days Sales Outstanding.
Days Sales Outstanding: Receivables divided by (Annual Sales/360), which measures how well the company gets its customers to pay.
Fixed Asset Turnover: Annual Sales divided by Net Fixed Assets.
Inventory Turnover: Annual Sales divided by Inventory.
Total Asset Turnover: Annual Sales divided by Total Assets.
Leverage Ratios (Also called Debt Management Ratios): Measures of how effectively a business is likely to repay its total debt
Debt Ratio: Total Debt divided by Total Assets. Also called Total Debt to Total Assets Ratio. Note: If someone talks about Debt Ratio or Debt-to-Equity Ratio, one should confirm their definition: sometimes Debt ratio is called debt to equity ratio, but technically Debt to Equity is Total Debt divided by (Total Assets – Total Debt).
Debt to Equity Ratio: Total Debt divided by (Total Assets – Total Debt). The term is often mistakenly used when Debt Ratio is actually meant.
Fixed Charge Coverage Ratio: (EBIT plus Lease Payments) divided by (Interest Charges plus Lease Payments),
Times Interest Earned Ratio: Earnings Before Interest and Taxes divided by Interest Charges.
Total Debt to Total Assets Ratio: Total Debt divided by Total Assets. Also called Debt Ratio.
Profitability Ratios: Measures of the profitability of the business.
Profit Margin on Sales Ratio: A Profitability Ratio, calculated as Operating Income divided by Annual Sales.
Return on Equity Ratio: A Profitability Ratio, calculated as Net Income divided by Shareholder’s Equity (which is Capital Shares plus Retained Earnings). Crucial to the shareholder, and thus a driver of the Share Price.
Return on Total Assets Ratio: A Profitability Ratio, calculated as Operating Income divided by Total Assets.
Market Value Ratios: Measures of stock price against earnings and book value of equity
Market/Book Ratio: Market price per share divided by Book value of Equity per Share. Market to Book value assesses the premium that a stock price has over a conservative valuation. Not derived solely from financial statements, and relates to a company’s market value.
Price/Earnings Ratio: Price per Share divided by Earnings per Share, which equals Market Capitalization divided by Net Income. Not derived solely from financial statements, and relates to a company’s market value.
Although most ratios have a standard definition, one should check what parameters are actually being used by a company to calculate its ratios. Some ratios do not follow generally accepted accounting practice (GAAP), and they are prone to possible misrepresentation.
Analyzing New Investment
The Time-Value of Money & Equivalence
A sum of money is not worth as much in the future as it is today. Interest is the cost of having the use of some money until a time in the future, which could otherwise have been used for something else today. Money has to earn interest to maintain its value. Equivalence allows the value of money at one point in time to be expressed at another point in time, for a given interest rate.
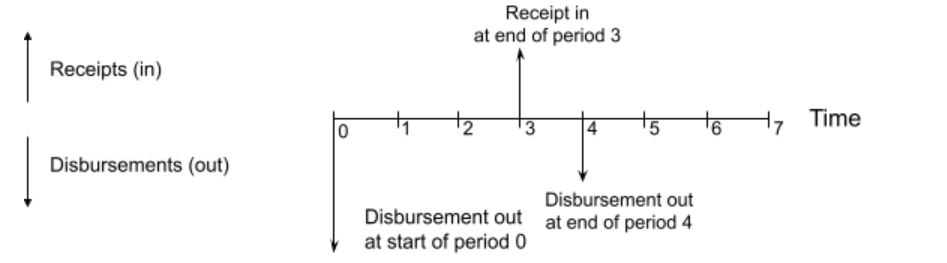
Cash Flow Diagram:
A cash flow diagram is used to visualize inflows and outflows over a time period. Time is plotted along a horizontal (divided into equal periods). Inflows are cash the company receives (also called receipts); these are shown as positive arrows which point up. Outflows are cash the company pays out (also called disbursements); these are shown as negative arrows which point down. The amount shown on the diagram is in terms of value at the time at which the activity takes place.
Key Assumptions
The original amount is called the Principal  .
.
Simple interest calculates interest on the Principal only.
Compound interest calculates interest on the Principal as well as the previous interest.
Calculations
Simple Interest:
The future value of a present sum (the Principal) at an interest rate  after
after  interest periods is:
![\[F = P * (1+i*n)\]](https://engcourses-uofa.ca/wp-content/ql-cache/quicklatex.com-e5327b6f628d792a852cc36349b704c9_l3.png "Rendered by QuickLaTeX.com")
Simple interest is almost never used in practice.
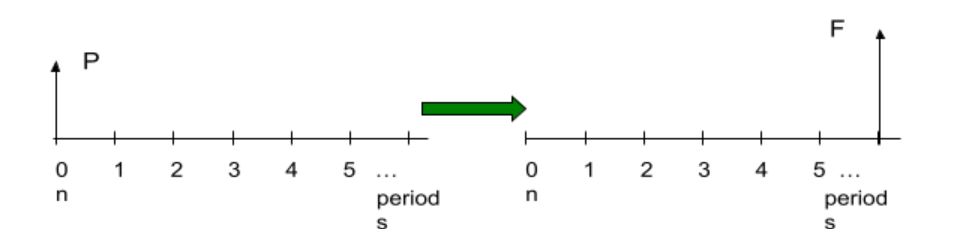
Compound Interest:
The future value of a present sum (the Principal) at an interest rate after interest periods is:
![\[F = P * (1+i)^n\]](https://engcourses-uofa.ca/wp-content/ql-cache/quicklatex.com-497b3f578515e1ce4c27d3e1a2db20c6_l3.png "Rendered by QuickLaTeX.com")
This is consistent with our understanding that money has to earn interest to maintain its value into the future.
The present value of a sum periods in the future is calculated by using a negative value for the number of periods:
![\[P = F * (1+i)^{-n}\]](https://engcourses-uofa.ca/wp-content/ql-cache/quicklatex.com-8fd585db28a0ba1df09975df7c8a5cc0_l3.png "Rendered by QuickLaTeX.com")
Equivalent Annual Interest Rate:
While the interest rate is quoted for an annual basis, in reality most loans have payment periods that are different from one year. The Effective Annual Interest Rate (EAIR) is the annual interest rate that takes into account any compounding that occurs over the year:
where  = the future sum, = the present sum, = nominal annual interest rate,
  = number of compounding periods per year, and = number of years,
![\[F = P * (1+\frac{i}{m})^{m*n}\]](https://engcourses-uofa.ca/wp-content/ql-cache/quicklatex.com-ee30a1f8fd9df092a37b90c29e105dc5_l3.png "Rendered by QuickLaTeX.com")
To find the future value of a present sum with some number of compounding periods per year, calculate it as though the interest rate was the EAIR compounded annually:
![\[F = P * (1+EAIR)^n\]](https://engcourses-uofa.ca/wp-content/ql-cache/quicklatex.com-1ee775be6ffe7c41071c1d27fd412713_l3.png "Rendered by QuickLaTeX.com")
Interest
Key Assumptions
For each method, the interest rate is assumed to be for the interest period. For example, if the period is one year, then the interest rate is the annual interest rate; but if the interest period is one month, then the interest rate for the period would be 1/12 of the annual interest rate. Interest rate, discount rate, and return rate all mean the same thing.
Calculations
Direct calculation methods and interest tables were developed to solve a number of different simple cash flow series. These cash flows are idealized cases (which makes them good for midterm questions that test understanding); but in practice most cash flow series are complicated and are easier to solve using spreadsheets.
Single Payment Compound Amount: The future amount at the end of periods after depositing a sum at the start of the periods, with interest rate .
In interest tables, use F = P x (F/P, i, n). The formula for direct calculation is:
![\[F = P * (1+i)^{n}\]](https://engcourses-uofa.ca/wp-content/ql-cache/quicklatex.com-9e4038e525af716b33840e45fa987981_l3.png "Rendered by QuickLaTeX.com")
(This is the same as same as the compound interest calculation in the previous section for the future value of a present sum.)
Single Payment Present-Worth Amount: The present value equivalent to a future amount at the end of the periods, with interest rate .
In interest tables, use P = F x (P/F, i, n). The formula for direct calculation is:

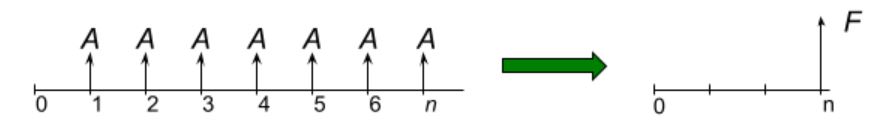
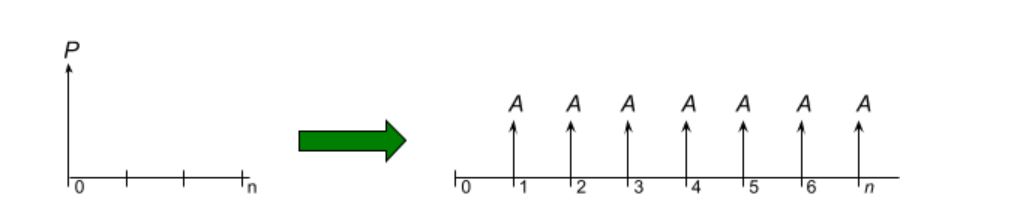
Uniform Series Compound Amount: The future amount at the end of periods after depositing a sum  at the end of each period with interest rate .
In In interest tables, use F = A x (F/A, i, n). The formula for direct calculation is:
![\[F = A * (\frac{(1+i)^n-1}{i})\]](https://engcourses-uofa.ca/wp-content/ql-cache/quicklatex.com-488809ad0bd9e597035f83750e9e9dff_l3.png "Rendered by QuickLaTeX.com")
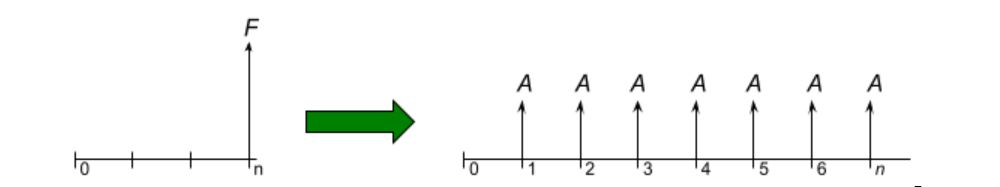
Uniform Series Sinking Fund: The amount that would have to be deposited at the end of the period for periods with interest rate to yield the future amount .
In interest tables, use A = F x (A/F, i, n). The formula for direct calculation is:
![\[A = F * (\frac{i}{(1+i)^n-1})\]](https://engcourses-uofa.ca/wp-content/ql-cache/quicklatex.com-5f04b2d870530af70d467b61d7c344df_l3.png "Rendered by QuickLaTeX.com")
Uniform Series Capital Recovery: The size of payments required at the end of each period to pay back a present sum over periods with interest rate .
In interest tables, use A = P x (A/P, i, n). The formula for direct calculation is:
![\[A = P * (\frac{i*(1+i)^n}{(i+1)^n-1})\]](https://engcourses-uofa.ca/wp-content/ql-cache/quicklatex.com-7e2e738710d9a0ce24a37f5ef5d8bddb_l3.png "Rendered by QuickLaTeX.com")
Capital Recovery Cost: A related calculation is the cost to recover capital, which is
CR = (P- S)(A|P, I, N) + iS
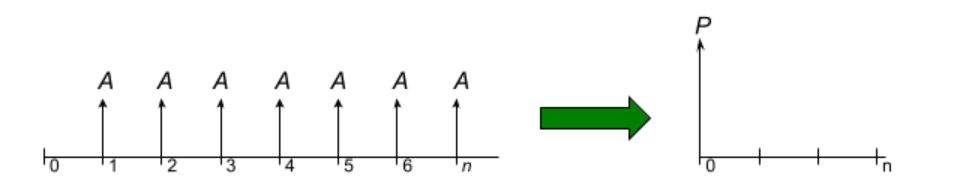
Uniform Series Present Worth: The present sum that would be required to invest now to provide end-of-period payments of for periods with interest rate .
In interest tables, use P = A x (P/A, i, n). The formula for direct calculation is:
![\[P = A * (\frac{(i+1)^n-1}{i*(1+i)^n})\]](https://engcourses-uofa.ca/wp-content/ql-cache/quicklatex.com-be3f278c7ad743084b86d71506a5d8ce_l3.png "Rendered by QuickLaTeX.com")
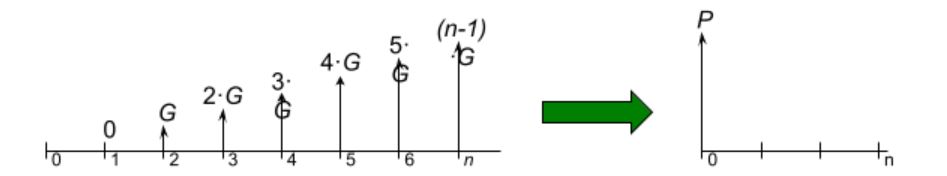
Arithmetic Gradient Present Worth: The present sum from depositing a uniformly increasing series of sums,  ,
,  , etc., for
  periods with interest rate . Note that the sequence starts at zero payment at the end of the first period, and the
  payment is at the end of period .
In interest tables, use P = G x (P/G, i, n). The formula for direct calculation is:
![\[P = G * (\frac{(1+i)^n-i*n-1}{i^2*(1+i)^n})\]](https://engcourses-uofa.ca/wp-content/ql-cache/quicklatex.com-2fe664d86f958a59f6fff5a01d300645_l3.png "Rendered by QuickLaTeX.com")
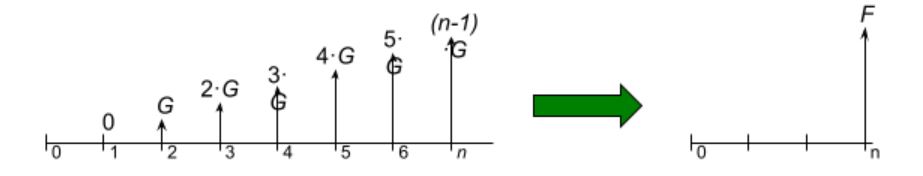
Arithmetic Gradient Future Worth: The future worth at the end of n periods, from depositing a uniformly increasing series of sums, at the end of the second period, at the end of the third period, etc., to  at the end of period , with interest rate . Note that the sequence starts at zero payment at the end of the first period, and the payment is at the end of period .
In interest tables, use F = G x (F/G, i, n). The formula for direct calculation is:
![\[F = G * (\frac{(1+i)^n-i*n-1}{i^2})\]](https://engcourses-uofa.ca/wp-content/ql-cache/quicklatex.com-c86e880f2ee43b58d997ed95618e890b_l3.png "Rendered by QuickLaTeX.com")
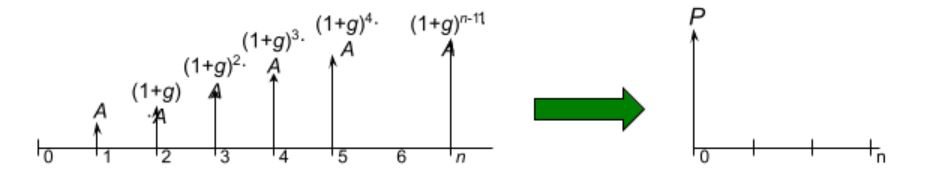
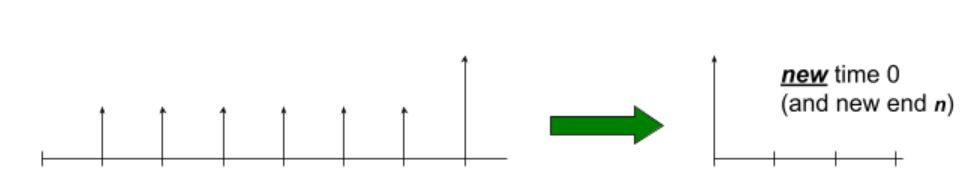
Geometric Series Present Worth: The present sum from depositing an increasing series of sums, at the end of period 1,  at the end of period 2, etc., up to a deposit of
  at the end of period with interest rate .
In interest tables, use P = A x (P/A, g, i, n). The formula for direct calculation is:
![\[if i \neq g\]](https://engcourses-uofa.ca/wp-content/ql-cache/quicklatex.com-60cd23a88f35ad8ae59bccf7c884c95c_l3.png "Rendered by QuickLaTeX.com")
![\[P = A * (\frac{1-(1+g)^n*(1+i)^{-n}}{i-g})\]](https://engcourses-uofa.ca/wp-content/ql-cache/quicklatex.com-33ea70b66e0683b88aa967bf8c565f18_l3.png "Rendered by QuickLaTeX.com")
otherwise:
![\[P = \frac{A*n}{1+i}\]](https://engcourses-uofa.ca/wp-content/ql-cache/quicklatex.com-c19ea14fad322c73cfd61209ad620998_l3.png "Rendered by QuickLaTeX.com")
Combinations
These formulæ can be used in combination to represent a more complicated set of cash flows, in a linear combination of series.
The formulæ can be used to convert from one type of series to another. One formula is used in an intermediate calculation of the equivalent (or , if you prefer), and then that value of (or ) is then substituted into another equation that yields the equivalent set of payments for a different type of series, or for an equivalent sum at a different point in time. Some examples include:
(F/P, i, N) = i(F/A, i, N) + 1(P/F, i, N) = 1 – (P/A, i, N)i
(A/F, i, N) = (A/P, i, N) – i
(A/P, i, N) = i / [1 – (P/F, i, N)]
(F/G, i, N) = (P/G, i, N)(F/P, i, N)(A/G, i, N) = (P/G, i, N)(A/P, i, N)
(F/A, g, i, N) = (P/A, g, i, N)(F/P, i, N)
Present Worth Analysis
Future values are a set of monetary values expressed in terms of the time at which each of the transaction occurs. Each amount is expressed in the value of the currency at that particular time, referred to as future dollars or more generally as “as-spent” dollars.
Present values (PV) convert the set of future values to the equivalent set of present sums in terms of a single value of currency at a single point in time, referred to as “today’s dollars.” This conversion is done using (P|F,i,n), where is the discount rate (or interest rate or return rate).
In Present Worth analysis, the focus is on the future. Any values from a time before the present time are ignored. These are called sunk costs.
The sum of the PV values over the course of the overall time determines the net present value (NPV) of financing plus the returns on the investment over and above the interest rate . A company usually has a discount rate that is the minimum that is acceptable as a “hurdle rate”: the Minimum Acceptable Rate of Return (MARR).
When MARR is used as the interest rate, then the NPV needs to be greater than zero to be accepted. (That’s why it is called a hurdle rate: the NPV has to be more than zero to clear the bar at MARR.) The Weighted Average Cost of Capital (WACC) is another hurdle rate that a company may use, which represents the cost of its financing and its overall level of investment risk. If the investment does not provide a return at that rate or better, then the company’s performance slips.
Calculating the Present Market Value of a Bond
When assessing an investment, it is important to consider what its current market value, to determine whether it is still a worthwhile investment or it should be sold.
In the case of a bond, the investment has a fixed “coupon” rate, meaning that the same amount is paid at the end of each year for a specified number of years, as a percentage of the face value of the bond (the Principal). At the end of the final period, you also get the Principal back (the original amount). The market interest rate is the discount rate that affects the future value of those amounts.
In reality, the market interest rate changes all the time, but for our purposes for future value calculation we assume that it is constant, because we have no information to make us believe that the discount rate is going to be different from what it is right now.
The market value of the bond now is simply the sum of the present value  of the uniform series of remaining annuity amounts plus the present value of the principal repayment (the original amount), using the market interest rate for the discount rate. The period is based on how many remaining payments will be made; annuity amounts that have already been paid in the past are not counted. The principal repayment of the original amount at the end of the term is a future value, which is why we have to calculate its discounted present value for the investment decision being made today.
Present Worth Analysis Using A Spreadsheet
Present Worth Analysis is most easily done using a spreadsheet program. The formulæ shown in the section above are useful for specific situations; but in reality, most cash flows are not as well behaved as the idealized series.
Calculation
To set up the spreadsheet, each future value is listed with the time at which occurs, expressed as a number of time intervals (usually years). The interest rate is entered into a cell on its own. Usually, the interest period is one year, but not necessarily.
Recall that the present value of a sum that is periods in the future (the future value ) is calculated by using a negative value for the number of compounding periods:
P = F x ( 1 +i )–n
This formula is used to calculate the present value of each of the individual future values.
In the example spreadsheet, the expression that is typed into cell $C$5 to calculate the present value of $100 at the end of period 1:
P = 100 x ( 1 + 0.03 )-1 is
=B5*(1+$B$2)^(-A5).
Note that an absolute cell reference is used for the interest rate in cell $B$2.
The future values are entered in column B starting “today” in row 4, with the value one period later in row 5, etc.
| A | B |
| Present value | |
| i = | 3% |
| n | FV |
| 0 | $0.00 |
| 1 | $100.00 |
| 2 | $100.00 |
| 3 | $100.00 |
The value in cell $C$6 calculates the present value at the end of year 2, which in this case is P = 100 x ( 1 + 0.03 )-2, the formula in the cell is =B6*(1+$B$2)^(-A6). The value in cell $C$7 to calculate the present value at the end of year 3, or P = 100 x ( 1 + 0.03 )-3, is =B7*(1+$B$2)^(-A7).
| A | B | C |
| Present value | ||
| i = | 3% | |
| n | FV | PV |
| 0 | $0.00 | $0.00 |
| 1 | $100.00 | $97.09 |
| 2 | $100.00 | $94.26 |
| 3 | $100.00 | $91.51 |
The NPV is simply the sum of the present values. In Excel, use the SUM( ) function. In this example the formula in cell $C$8 is
=SUM(C4:C7)
| A | B | C |
| Present value | ||
| i = | 3% | |
| n | FV | PV |
| 0 | $0.00 | $0.00 |
| 1 | $100.00 | $97.09 |
| 2 | $100.00 | $94.26 |
| 3 | $100.00 | $91.51 |
| NPV | $282.86 |
In this particular example, the NPV of the series happens to be the same as the Uniform Series Present Worth in the case of P =100 x (P/A, 3%, 3).
Here is a tip for setting up a spreadsheet for NPV: Use an absolute reference for the interest rate. Remember that the convention for an absolute reference to a cell is to use dollar signs in front of the column (letter) and/or the row (number), $B$2 in this example. In this way, the present value is calculated by pointing directly to the cell that has the number that you use repeatedly, in this case, the interest rate. A common error can occur when setting up the spreadsheet by copying cells into another location that end up referring to the wrong cell. Check your calculation formulæ in the cells to make sure you are using the correct parameters from other cells.
Rate of Return
The internal rate of return (IRR) is the interest rate for which the sum of present values totals to zero. This is the rate of return at which the benefits of the investment are the same as its costs. If the IRR is greater than MARR, then it is a worthwhile investment.
If IRR is higher than MARR, then later future sums have more value at the MARR hurdle rate than at the IRR rate, which means that the investment will deliver value beyond what is demanded at the MARR. If IRR is below MARR, then later future sums have less value at the MARR hurdle rate than at IRR rate, and so the investment will not deliver value required at MARR.
Calculation:
Tabulate a time series set of future values on a spreadsheet and calculate their individual present values using a first guess at the IRR interest rate. Calculate the Net Present Value of the series of Present Values. Then, use the Excel solver function to make this IRR Present Value total equal to zero by solving for the IRR interest rate, which is chosen by selecting the cell that contains the interest rate.
It is good practice to create an additional column in a spreadsheet for each present value case (e.g. MARR and IRR). You should question an IRR in the bazillions of percent; a common error is not putting the correct signs on costs or benefits.
Solving for i of a Cash Flow Series by Interpolation Using Interest Tables
We can find an approximate solution for the interest rate for a cash flow series which we can express as a formula, provided that is the only unknown, by finding the value of the formula factor, and then interpolating in the interest table to find the approximate value of .
Incremental IRR
Incremental IRR (IIRR) is used for an investment that is being considered as an alternative to another investment. The investment with the lower capital cost is considered to be the base case. The cash flow of the higher-capital-cost alternative (in future dollars) is subtracted from the cash flow of the base investment (also in future dollars) to give the incremental cash flow. The IIRR is then found using an iterative solution (such as Solver in Excel) for the series of present values of the incremental cash flow that gives an NPV of $0. If the IIRR is greater than MARR, then the higher capital cost alternative should be selected, because it adds enough extra value to be worthwhile. In fact, if the IIRR is greater than the IRR of the base investment, then the incremental investment adds more value to the investment on a relative basis than the base investment does.
Other Analysis Techniques
Benefit-Cost Analysis
The Benefit-Cost ratio compares the Present Worth of the benefits of an investment PWbenefits, and the Present Worth of the costs PWcosts
BCR = PWbenefits / PWcosts
If BCR < 1, then the benefits are less than the costs, and so the investment is not worthwhile.
Incremental Benefit-Cost Analysis
Incremental Benefit-Cost analysis compares increasing costly alternatives.
- For each option, calculate the PW of its benefits the PW of its costs, and its Benefit to cost ratio. Reject any option that has a BCR < 1.
- Arrange the remaining options in ascending order of costs.
- Then calculate the incremental BCR between cases, starting with the lowest two cost options. As analysis proceeds, reject any option that gives an incremental BCRs that is less than 1, and use the next higher cost option to calculate the incremental BCR.
- Once all the valid incremental BCRs have been calculated, choose the option with the highest cost that still has an acceptable incremental BCR (that is, greater than 1). Note that the choice will not necessarily have the highest BCR.
Payback
Payback happens when an investment has paid for itself. The point at which the cumulative sum of values becomes positive is when payback occurs.
For engineering projects, the payback time is usually counted as the time from start-up (that is, the first period in which there is positive cash flow) to the point at which the sum of the series of time values goes positive, rather than counting from the beginning of the project itself. Payback usually happens in the middle of a period, but payback period is usually expressed as an integer: the end of that period minus beginning of start-up. For example, if an engineering project started at the beginning of year 1, started up sometime in year 4, and the sum of values went positive sometime in year 11, then the payback time is
11 – 4 = 7 years. Some people interpolate within a year to get more precision, but it’s not usually worth the extra effort, given the inherent uncertainties in such analyses.
Simple payback is found from the series of future values.
Discounted payback is found from the series of present values (the discounted values of the future sums).
Break-Even Analysis
Break-even analysis considers the effect of a parameter in an investment option on its equivalence to another investment option. The key is to express one investment option in terms of the variable to be solved and the equivalent value of the other option.
If the cash flow is simple, then it is often easiest to solve for a parameter directly using an interest formula and solving by interpolation from the interest tables. Of course, a spreadsheet can be used with the Solver function to find the value of the parameter.
Solving for n of a Cash Flow Series by Interpolation Using Interest Tables
Break-even analysis is often concerned with the time period associated with different investment options. Interpolation can also be used to find the value of . In Lecture 27, there is a break-even analysis problem that determines how many years a corrosion-resistant part has to last to have the equivalent uniform annual cost of the untreated part. The untreated part costs $350 and lasts 6 years, so the uniform annual costs is $350 x (A|P,10%,6) = $80.36. The corrosion-resistant part equivalent uniform annual cost (Option B) must be at least this low, so we have to find the number of years that will give the same amount, i.e., $500 (A|P,10%, n) = $80.36. So now we know that (A|P,10%, n) = $80.36 / $500 = 0.1607, and we look in the Uniform Series Capital Recovery Table (on slide 13 of Lecture 21) and find that in the column for (A|P,10%,n) the value 0.1627 for = 10 and 0.1540 for =11. That means that the solution lies somewhere between 10 and 11 years. By interpolation, we can solve = 10 + (0.1627 – 0.1607)/(0.1607 b- 0.1540) = 10.23 years.
Picture
What Is Included in the Cash Flow Series for an Investment Project
In evaluating an investment, only future costs are considered. The cash flow series should only include the incremental costs to do the project, and none of the costs associated with running the current business. For example, allocation of costs for head office overheads does not enter into a cash flow analysis, since no incremental money is spent. (The head office would run whether the project went ahead or not.) Providing an accounting reserve for future expenditures is a common accounting practice (recall that allowances are used to blend out expenditures); but cash flow forecasts use actual cash flows that are expected to occur, not allowances. Some projects may do preliminary project development work as part of regular business activities. These sunk costs would not be attributed to the project.
Inflation
Inflation is a quantitative measure of how much the purchasing power of money decreases as time moves forward. (Remember that a dollar tomorrow will buy less than it does today.) Inflation is a negative compound interest, i.e., 3% inflation is like a -3% interest rate. A long period of inflation occurs in a country when the money supply (the amount of a currency that is in circulation) grows at a faster rate than the country’s rate of economic growth.
In reality, the inflation rate varies continually over time and in different regions. In this course, the inflation rate is assumed to be fixed unless stated otherwise.
Calculation:
Real Interest Rate
The real interest rate for a period  is only approximately equal to the nominal inflation rate
  minus the inflation rate
![\[ i_r = i_n - <strong><em>f</em></strong>\]](https://engcourses-uofa.ca/wp-content/ql-cache/quicklatex.com-7ba6bb77f1649a2c700659d93831e314_l3.png "Rendered by QuickLaTeX.com")
The more accurate formula for real interest rate is:
![\[ i_r = \frac{1-i_n}{1+f} -1\]](https://engcourses-uofa.ca/wp-content/ql-cache/quicklatex.com-1236fb2f5e772766f76301e7a79689ff_l3.png "Rendered by QuickLaTeX.com")
If the interest rate (or discount rate) needs to include inflation, then the real interest rate should be used.
Net Present Worth including Inflation
A calculation of NPV is typically done using a nominal MARR. If inflation is a factor, then NPV should be calculated using inflation-corrected future values. This is done as follows:
- Adjust the future values in each period for inflation (the future values will go up, reflecting the equivalence associated with the declining value of money).
- Then calculate the PVs using these inflation-corrected future values and the nominal MARR. In the case of taxable income, do the inflation calculation first to get the inflation-corrected FV of the cash flows before doing the tax calculation.
An alternative approach is to use the nominal future values and a MARR that is corrected for inflation:
- Use the future values as quoted, without any inflation correction, and then use the real MARRreal = (1 + MARR)/(1 + f) – 1.
Caution: This alternative method only works if there is no intermediate calculation to do, such as taxes, and so it is prone to error. For this reason, the first method is preferred.
After-Tax Cash Flow
Key Assumptions
After-tax cash flow is discussed for revenue from normal operations, i.e., earnings before interest and taxes is considered to be the same as operating income.
The tax implications of Other Income depend on the specific situation (including how interest is earned and booked as Other Income), and so its tax is handled on a case-by case basis and not discussed further here.
In some cases, depreciation may have been booked as a non-cash expense in Operating Income. In that case, the taxable cash flow from operations will be the sum of operating income with depreciation and other non-cash expenses added back in.
Calculation:
For each year, the after-tax income involves a set of calculations:
1) Take the Operating Income and adjust for any expenses that are not eligible for tax deductions (e.g. some kinds of meal expenses). Interest on loans is a taxable expense.
2) Add depreciation back into the Operating Income (if necessary) to give the taxable cash flow from operations. (If inflation is a factor, then Operating Income is corrected for inflation before doing the taxation calculations in subsequent steps.)
3) Calculate the Capital Cost Allowance (CCA) for each class of capital costs (using the Canada Revenue Agency guidelines). (See Depreciation for Tax Purposes in the section on depreciation in this guide for details on how to do that calculation.)
4) Deduct the CCA (up to the limit of net income from all sources) to get the taxable income. Taxes for an incremental cash flow may actually be negative, if enough other sources of income exist in the company from which to deduct taxes. (See the section below if there is disposal of an asset in the year being considered.)
5) Calculate income tax payable based on taxable income and the applicable percentage tax rates for the business.
6) Deduct the income tax from taxable income to get net income after tax for the year of interest. This is the after-tax cash flow for that year.
This set of steps is done for each period (generally annually) over set of intervals in time to give a series of after-tax cash flows, which is a set of future sums. For a series of after-tax cash flows, the NPV is calculated using the same procedures as for any other time-series of future sums.
Accounting for Salvage Value
Because CCA is calculated using declining balance (i.e., it carries on forever), disposal of assets is not straightforward. A disposal tax effect (DTE) is included to account for the fact that salvage value is either a loss or a gain in the year in which it occurs. DTE in year is equivalent to the difference between the salvage value and the UCCt book value multiplied by the tax rate  :
:
DTE = (UCCt – SalvageValue) x TR
The After Tax Cash Flow in that year includes the Salvage Value and the DTE:
ATCF = ATCFNominal + Salvage Value + DTE
Three cases are of interest:
- If an asset is sold for less than its UCCt value, then theDTE is positive.
DTE = (UCCt – SalvageValue) x TR (positive, so ATCF ↑)
2) If an asset is sold for greater than its UCCt value, then theDTE is negative (salvage value is larger than remaining unclaimed capital cost), meaning the tax effect is a recapture of what was allowed previously (Tax n Recapture), and so there an increase in taxes (i.e., ATCF is reduced by DTE).
DTE = (UCCt – SalvageValue) x TR (negative, so ATCF ↓)
3) If an asset is sold for greater than its purchase price (Basis Value), then the DTE is negative (as in case 2 above), but the DTE is equal to the sum of two tax effects, tax on recapture, and capital gains tax. These are tracked differently, because the capital gains tax rate is only half of the normal tax rate:
Tax On Recapture = (UCCt – BasisValue) x TR
Capital Gains Tax = (BasisValue – Salvage Value) x TR / 2
DTE = Tax On Recapture + Capital Gains Tax
Loan Principal Repayment:
When a loan is taken out, there is an agreed schedule for payments. Mortgage payments are generally done on a level payment basis. Each payment is the same; and that payment will be the sum of the interest on the remaining principal amount for the period, plus some repayment of the principal. Because part of the principal gets paid off, the interest amount goes down over time and more of the payment goes toward paying down the remaining principal amount.
The interest part of a payment in a particular period is the principal for that period times the interest rate. The mortgage payment minus the interest is applied to repayment of the principal, and so the principal for the next period is the current principal minus the repayment.
Because interest is a taxable expense, the cost of interest is subtracted from income before debt service (that’s the interest portion only, not the principal repayment part). That pre-tax net income then has the taxes subtracted (at the tax rate) to yield the after-tax net income. The cash flow after tax is typically the after-tax net income with depreciation added back in (a simplification of the real world).
Principal repayment is done using after-tax dollars, and so
Cash flow after tax and principal repayment = Cash flow after tax – principal repayment.
Cost of Capital
Our investment analyses typically ignore the cost of capital. That is, there is no explicit financing cost, because the company operates from its own cash flow. In reality, the company may have to borrow money to finance the investment. In that case, the cost of capital needs to be included, whether financed by debt or equity. Simple forms of calculating these costs are shown below.
Cost of Retained Earnings:
kr= D1 / P0 + g
Cost of New Common Stock:
ke= D1 / [P0(1-fc)] +g
Cost of New Preferred Stock:
kp= D* / [P* (1-fc)]
Cost of Equity:
ie= (cr/ce)kr + (cc/ce)ke + (cp/ce)kp
After-Tax Cost of Debt:
id= (cs/cd)ks (1- tm) + (cb/cd)kb (1- tm)
Cost of Total Capital:
k = idcd/V + iece/V
Uncertainty
Key Assumptions
Most of our calculations have been done with the assumption that the parameters are known. In reality, there is often a lot of uncertainty in our estimates, and no one really knows what interest rates will be a couple of years in the future. To deal with such uncertainty, analysts use probability distributions or other methods to describe the uncertainty. A simple way to describe uncertainty is to state the most likely value, and a number on either side that represents the “worst-case” value and the “best-case” value. Ideally these would bracket the risk associated with the uncertainty.
Calculations
For each parameter, choose a value for the most likely case, the worst case, and the best case.
Best-Case/Worst-Case Scenarios
Do the analysis first using the most likely values for the parameters. This gives the realistic result.
Repeat the analysis, assigning all the uncertain parameters their best-case values. This gives the optimistic result.
Repeat the analysis, assigning all the uncertain parameters their worst-case values. This gives the pessimistic result.
Sensitivity Analysis
Do the analysis first using the most likely values for the parameters. This gives the realistic result.
Repeat the analysis, but varying only one of the uncertain parameters. The set of results shows the sensitivity of the answer to variability of that particular parameter. Computing the variation of a particular parameter that would cause a decision to change yields the sensitivity of the decision to that parameter.
Monte Carlo Analysis
A more sophisticated uncertainty analysis uses not just three values for the range of a parameter, but a broader range in a probabilistic distribution. (The distribution can be a continuous function, or it can be a discrete set of values.) Monte Carlo analysis does the same analysis over and over, picking random variables from all of the probably distributions of the parameters. The result is a probabilistic representation of the result of the analysis.
Concluding Note
This guide illustrates calculations for simple financial scenarios to do a preliminary assessment of operational performance and potential return on investments. Please note that in reality, financial situations may be very complex. Be prepared to seek professional advice to deal with cases beyond what is described in this course.
Glossary of Terms
This glossary gives brief explanations of many terms used in the text Financial Management for Engineers, plus a few extras. It does not give definitive descriptions.
A
Accounting: Categorizing and interpreting transactions to provide the financial context for business decision making.
Accounts Payable: A Current Liability. See Payable.
Accrual: A Current Liability. See Accrued Expense.
Accrued Expense: A Current Liability. Booking an obligation of a payment that has yet to be made, such as wages owed but not yet paid.
Acid Test: A Liquidity Ratio. See Quick Ratio.
Activity Ratios: Financial ratios that measure how effectively assets are being used in the business (Inventory Turnover, Average Collection Period, Fixed Asset Turnover, Total Asset Turnover). Also called Asset Management Ratios.
All In Income: Operating Income minus expense of interest on long-term debt.
Allowances and Returns: An adjustment for wrong shipments and returned goods that for some reason can not be returned to inventory. One of the costs that is subtracted from Gross Revenue to calculate Net Revenue, along with Bad Debt and Warranty Work.
Amortization: The period of time over which a series of payments is made. Sometimes used as a synonym for Depreciation.
As Spent: Money as it was valued at the time of expenditure, as opposed to its present or future value
Asset: An item of value that is held by the business. The sum of Assets always equals the sum of Liabilities (what is owed to others) plus Equity (what owners have contributed to the business). An accounting category.
Asset Management Ratios: See Activity Ratios.
Authority: The delegated ability to do a job function and be held accountable for its responsibilities. Signing authority for expenditures is an example of authority delegated to an employee.
Average Collection Period: An Activity Ratio. See Days Sales Outstanding.
B
Bad Debt: A loan or receivable that can not be collected at all or only at a steep discount. One of the costs that is subtracted from Gross Revenue to calculate Net Revenue, along with Allowances and Returns and Warranty Work.
Balance Sheet: A financial statement documenting the assets that a business has at a point in time, and where the money came to acquire those assets.
Bankruptcy: Failure of a business to raise sufficient cash to pay its expenses (including servicing its debts).
Billable Hours: The basic unit of sales for a business that provides services, such as a consultancy or a law firm.
Book Break Even: The point at which Operating Income becomes positive, under the assumption that interest on long-term debt is expensed before calculating Operating Income.
Bookkeeping: The process of tracking (monetary) transactions in a business
Budget: A financial document that estimates the expected expenses and revenues for an upcoming interval, usually three months or a year.
Budgeting: The process of developing a budget.
Business Plan: An projection of expected business operations, based primarily on Sales Revenue and Operating Expenses, often looking out five or ten years.
C
Capital Cost Allowance: Rules for claiming a tax deduction against income for depreciation purposes before the tax is deducted.
Capitalized Cost Analysis: A Present Worth Analysis in which the alternatives each have infinite analysis periods.
Cash: A liquid asset that can be spent immediately. The ability to raise cash to keep operations going is the most important short-term management function.
Cash Break Even: The point at which Cash Flow from Operations (Operating Income plus Depreciation) becomes positive. (Depending on the company, interest on long-term debt may be expensed before calculating Operating Income, or interest on long-term debt may appear as a negative entry in Other Income.) More important for small businesses, which otherwise would have to dip into reserves to keep the business going. Cash Breakeven Point can be calculated as (SG&A – depreciation) / contribution margin per unit.
Cash Flow Diagram: A graphical representation of how cash enters and leaves an organization over a period of time. Very useful for understanding how to calculate interest.
Cash Flow from Operations: Operating Income plus Depreciation, the cash generated from normal business (calculated before tax).
Contribution Margin: Net Revenue minus Cost of Goods Sold. A measure used for evaluating sales and marketing effectiveness, and for setting price of marginal sales. Sensitive business information that should not be revealed to competitors. Also called Margin.
Constraint: A limit on a resource, e.g. the rate at which a machine can produce widgets, or the volume of a storage tank.
Corporation: A business organization that has the legal status of a person. The owners of a corporation are generally not legally responsible for its debts or actions.
Cost of Goods Sold: The expenses directly related to purchasing or producing products or services for sale. Also called Direct Costs or Marginal Costs.
Cost Plus: A type of contract where allowable costs are reimbursed and an incremental percentage is paid for overhead and profit.
Cost Tracking: Monitoring expense transactions.
Covenants: Terms and conditions that a business must meet to maintain a contract (such as a short term credit line) with a lender.
Covering the Nut: See Cash Break Even.
Credit: 1) A positive influx of money into a liability account or an equity account, but an outflow of money from an asset account. A transaction includes both a credit and a debit. 2) A type of loan.
Current Assets: Asset accounts that generally have some activity within a year: e.g., Cash, Receivables, Short Term Investments, Inventory, and Prepaid Expenses. Grouped together on the Balance Sheet.
Current Liabilities: Liability accounts that generally have some activity within a year: e.g., the Short-Term Credit Line (negative cash), Accounts Payable, Accrued Expenses, Taxes Payable, and the Current Portion of the Long-Term Debt. Grouped together on the Balance Sheet.
Current Ratio: A Liquidity Ratio, calculated as Current Assets divided by Current Liabilities.
Current Portion of Long Term Debt: A Current Liability related to the amount of long-term debt that must be paid within the coming year, that is, the amount of principal (not interest) that will be due within one year of the date of the balance sheet in which it appears.
D
Days of Sales: Money owed as Receivables divided by monthly Sales, multiplied by 30.
Days Payables: Payables (in dollars) divided by the product of Monthly Sales times (1 minus Contribution Margin) all multiplied by 30.
Days Sales Outstanding: An Activity Ratio, calculated as Receivables divided by (Annual Sales/360), which measures how well the company gets its customers to pay.
Debit: An outflow of money from a liability account or an equity account, but an influx of money to an asset account. A transaction includes both a debit and a credit.
Debt: Money legally owed to others. Long-term debt is typically secured against specific assets, so holding debt in a company is less risky than holding equity.
Debt Management Ratios: See Leverage Ratios.
Debt Ratio: A Leverage Ratio, calculated as Total Debt divided by Total Assets. Also called Total Debt to Total Assets Ratio. Sometimes Debt ratio is called debt to equity ratio, but technically Debt to Equity is Total Debt divided by (Total Assets – Total Debt).
Debt to Equity Ratio: A Leverage Ratio, calculated as Total Debt divided by (Total Assets – Total Debt). The term is often mistakenly used when Debt Ratio is actually meant.
Depreciation: A non-cash expense that recognizes that an asset such as equipment wears out over time, which can be thought of as a charge against revenue that recovers the cost of the original assets that are wearing out. There are different classes of depreciation, which depend on the type of asset.
Direct Costs: See Cost of Goods Sold.
Dividend: A one-time payment to investors as a use of funds, reported as a negative entry in the Statement of Cash Flow.
Double Entry: Tracking a transaction simultaneously as a debit in one category and a credit in another, because money comes out of one account and goes into another. One outcome of double-entry bookkeeping is maintaining balance between Assets and the sum of Liabilities plus Equity. The parts of a transaction can be all in one category or two different ones. A physical analogy is conservation of energy, in which energy can be transformed into different forms, but neither created nor destroyed. As Gertrude Stein wrote: “Money is always there but the pockets change; it is not in the same pockets after a change, and that is all there is to say about money.” Very astute for a novelist who was not an accountant.
E
Earnings Before Interest and Taxes: Net Income without subtracting interest charges or income taxes.
Earnings Before Interest, Taxes, and Depreciation: Net Income without subtracting interest charges, income taxes, or depreciation.
Equity: The value that owners have in a business. The sum of Share Capital plus Retained Earnings. Also called Capital, or Shareholder’s Equity. An accounting category.
Equivalence: The property of money that allows a shift of any sum to an equivalent sum at some other point in time. The premise under which investment analyses can be compared at different points of time.
Equivalent Annual Interest Rate: The actual interest rate that would be charged annually that would have the equivalent yield to multiple compounding periods during the year.
Expense: Money that leaves the business. An accounting category.
Externalities: Things outside an organization that it can use for free. If used excessively by one or many, externalities come under pressure and cause harm to society, in which case government regulation (which may include taxation) is necessary to preserve it. Highways and the atmospheric environment are examples of externalities.
F
Fiscal Year: The annual period in which business is conducted and reported. Many companies start their Fiscal Year at the beginning of a quarter, not necessarily January. Governments in Canada start their Fiscal Year on April Fool’s Day.
Fixed Asset: A real, physical thing that a company owns, such as a piece of equipment, a building, and land. Land does not depreciate, but almost all other assets do. Fixed assets are sometimes pledged as security for long-term debt. Fixed assets not liquid assets, and so they are grouped together with long term investments and intangible assets on the Balance Sheet.
Fixed Asset Turnover: An Activity Ratio, calculated as Annual Sales divided by Net Fixed Assets.
Fixed Charge Coverage Ratio: A Leverage Ratio, calculated as (EBIT plus Lease Payments) divided by (Interest Charges plus Lease Payments),
Fixed Costs: Costs that do not vary with the amount of production (e.g. number of units produced). In reality, a fixed cost does have a constraint related to production. See Sales General and Administrative Expense.
Forecast: A revised budget for the remainder of the Fiscal Year.
Fundamental Equation of Accounting: Assets = Liabilities + Equity.
Future Worth: The equivalent sum at some future point in time, which depends on the interest rate.
G
Gain: Creating value in a business.
Goodwill: 1) In accounting of a Balance Sheet, an intangible asset arising when a company is purchased for more than its book value. 2) In business parlance, goodwill is the ability to exert influence on someone or within a group without having to resort to the use of an asset.
Governance: In corporate terms, the manner in which the Board (or another form of owner representation) directs a corporation, and the laws and customs applying to that direction, to align the actions of the individual parts of an organization to support corporate objectives, and in such a way that each part of the organization can trust other parts to contribute to the mutual benefit of the organization with consistency and accountability, with none gaining unfairly at the expense of others (modified from Wikipedia).
Gross Revenue: The total revenue that comes into a company in a reporting period.
Gross Sales: Sales Revenue before subtracting Bad Debt. See Gross Revenue.
H
Human Resources: The part of an organization that deals with developing and applying policies and procedures for fair and equitable treatment of the people in the organization.
Hurdle Rate: See Minimum Acceptable Return on Investment.
I
Illiquid Asset: An Asset that can not be readily converted into Cash.
Income Statement: A financial statement documenting how much income is accumulated by a business in a meaningful period of time, i.e., rate of earning.
Incremental Internal Rate of Return: The Internal Rate of Return (IRR) of the difference in incremental cash flow between two investment alternatives, hence ∆IRR is the return on the additional spending. The general rule is to choose the most expensive option if ∆IRR is above the Minimum Acceptable Rate of Return.
Indirect Expenses: See Sales General and Administrative Expenses.
Intangible Assets: Trademarks, patents, franchise fees, Goodwill, and other business items that are valued as Assets despite not being tangible objects. They may depreciate.
Intellectual Property: Legally protected information owned by a business, including (but not limited to) trademarks, patents, documented business processes, proprietary technical information, and trade secrets.
Interest: The time value of money for a debt investment, as payments at an agreed schedule from a borrower to a lender. An operating expense to the borrower (payer), reported on the Income Statement in SG&A or a negative entry in Other Income. Income to the lender. Similar to Return on Investment, which the time value of money for Equity.
Interest on Long Term Debt: A financing expense reported as a negative entry in Other Income.
Internal Rate of Return: The effective interest rate at which the Net Present Value of an investment’s cash flows (including costs) is zero. The most common criterion by which investment decisions are made. Often called Return On Investment (ROI), the return provided by the entire cost of the investment.
Inventory: Parts, Raw Material, partially completed products, and finished goods not yet sold. A Current Asset which could be sold for Cash if absolutely necessary (but probably at a steep discount). Often measured in Days of Sales.
Inventory Turnover: An Activity Ratio, calculated as Annual Sales divided by Inventory.
J
K
L
Leverage Ratios: Financial ratios that measure how effectively a business is likely to repay its total debt (Debt Ratio, Times Interest Earned, Fixed Charge Coverage). Also called Debt Management Ratios.
Liabilities: Value borrowed from others to support the business. An accounting category.
Liquid Asset: Value in the business that can be converted readily into Cash, which is the most liquid asset of all. Current Assets are more liquid than fixed assets.
Liquidity Ratios: Financial ratios that measure the likelihood that a business will remain solvent in the short term (Current Ratio, Quick or Acid Test Ratio).
Loan: Borrowing to finance a business.
Loan Repayment: A sum of money with two components: interest to the lender, and repayment of the Principal. There are different methods for Principal repayment.
Long Term Investments: Financial investment Assets such as bonds. Not commonly held by manufacturing and technology businesses.
Loss: The destruction of value in a business.
M
Maintenance: An operating expense associated with keeping equipment and facilities operating within performance specifications.
Management: 1) A business activity concerned with planning, financing, organizing, and operating an organization, through working with people. 2) A term for the group of employees within the company that have formal supervisory roles and responsibilities related to those activities.
Margin: See Contribution Margin.
Marginal Costs: Variable costs of an operation. See Contribution Margin.
Market Capitalization: Usually defined as the total value of a company’s stock.
Market Value Ratios: Financial ratios that measure stock price against earnings and book value of equity (Price/Earnings, Market/Book).
Market/Book Ratio: A Market Value Ratio, calculated as market price per share divided by Book value of equity per share. Market to Book value assesses the premium that a stock price has over a conservative valuation. Not derived solely from financial statements, and relates to a company’s market value.
Materiality: The allowable error in tracking transactions, which is defined by the business. Any material errors in transactions (those larger than the standard) are corrected after the reporting period by a post-period adjustment.
Minimum Acceptable Rate of Return: The lowest return that you are willing to earn on an investment. Also called Hurdle Rate.
N
Net Cash Flow: The measure of the short-term viability of a business. Generally defined as net income with the depreciation amount for the period added back in. Negative net cash flow is a very bad thing if it persists for more than a short time.
Net Fixed Assets: The cost of purchasing assets minus the accumulated depreciation.
Net Income: The measure of creation of value by a business in a reporting period. This course almost always refers to Net Income as Operating Income plus Other Income (before tax). Considering earnings before tax is appropriate for operations management and for valuing a company, but not for overall corporate financial management.
Net Present Value: The total present worth of a series of sums. See also Present Worth.
Net Revenue: Gross Revenue minus Bad Debt, Allowances and Returns, and Warranty Work.
Net Sales: Gross Sales minus Bad Debt.
Non-Cash Working Capital: The sum of current assets except cash minus the sum of current liabilities except the short-term credit-line and the current portion of the long-term debt.
O
Offset: An expenditure that can be sacrificed in order to allow for another (typically unbudgeted) expenditure.
On Budget: The happy situation when the Income Statement matches the original projection in the Business Plan.
Operating Income: Net Revenue minus COGS minus SG&A, the income a business is generating from normal activities. Calculated before tax
Other Income: Unusual or one-time cost or revenue that is not related to normal operations. In many companies Other Income also includes the expense of interest on long-term debt. By separating the cost of financing from the operating costs, the normal earning power of the business is not distorted.
Outlook: Predicted expenditures for the remainder of the fiscal year.
Over Budget: The unhappy situation when the Income Statement does not match the original projection in the Business Plan, because higher than expected costs have reduced Net Revenue below what was expected.
Overhead See Sales, General & Administrative Expense.
P
Partnership: A business organization in which the owners share the equity and liability directly, as well as being responsible for any debt and any legal actions against the business.
Payable: A Current Liability of money owed to a supplier, expressed in Days (Days of COGS not Days of Sales).
Payback: An estimate of how long it will take to recoup an investment. A long Payback period typically holds more risk for the investor. Payback comes in two forms: Simple (using as-spent dollars) & Discounted. Simple Payback is more commonly used.
Payroll: A business function that controls cash payments to employees in exchange for their labour.
Prepaid Expenses: A Current Asset representing the remaining fraction of an ongoing expense that was paid up front, to distribute the booking of the expense over the year.
Present Worth: The equivalent sum at the present time. Present worth analysis compares the net present value of multiple mutually exclusive options. Only future income and expenses are used; “sunk costs” in the past are considered to be irrelevant.
Price/Earnings Ratio: A Market Value Ratio, calculated as Price per Share divided by Earnings per Share, which equals Market Capitalization divided by Net Income. Not derived solely from financial statements, and relates to a company’s Market Value.
Principal: The original amount of a loan. Principal repayment is not treated as an expense to the borrower; and it does not create income for the lender.
Principle: An idea that guides behaviour. Groucho Marx once quipped: “I have Principles. And if you don’t like those, then I have other Principles.” Groucho Marx is better known as a humourist than as an ethicist.
Procurement: 1) The business function that acquires Assets. See Purchasing. 2) The stage of a project when raw material and other assets are purchased, which comes prior to construction and commissioning.
Profit: Creating value in a business.
Profit Margin on Sales Ratio: A Profitability Ratio, calculated as Operating Income divided by Annual Sales.
Profitability: The point beyond which margin exceeds SG&A (with depreciation included), and the business is creating enough value to cover depreciation and still turn a profit.
Profitability Ratios: Financial ratios that measure the profitability of the business (Profit Margin on Sales, Return on Total Assets, Return on Equity).
Public Statement: A disclosure of earnings that anyone can see, constructed so as not to reveal key business information (such as Contribution Margin).Purchasing: Buying Inventory and other Assets for a business.
Q
Quarter: A three-month period.
Quick Ratio: A Liquidity Ratio, calculated as (Current Assets minus Inventories) divided by Current Liabilities. Sometimes called the Acid Test Ratio.
R
Raw Material: Unprocessed inventory, such as metal bar stock, chemicals, bulk plastic, etc.
Receivable: Money coming into the business from sales of goods already shipped. A Current Asset that is considered to be almost as liquid as cash. Typically measured in Days of Sales to show how long it takes to collect money from customers after the sale is booked.
Regulation: Legal limitations on how a business can be conducted.
Reliability: The ability of an asset to perform its function within specifications for a period of time. Reliability is generally consumed over time by operating an asset, and reliability is restored by doing maintenance.
Repayable Grants: A Liability related to Long Term Debt.
Reporting Period: The time interval in which financial transactions are reported, typically monthly for internal management, with quarterly and annual summaries.
Retained Earnings: Money that remains in the business (as opposed to leaving the business and going back to the owners as a Dividend), but not kept as a separate cash reserve. Incremental Retained Earnings are Net Income minus Dividends, reported annually.
Retention Strategy: Incentives intended to keep employees from seeking employment elsewhere.
Return on Equity Ratio: A Profitability Ratio, calculated as Net Income divided by Shareholder’s Equity. Crucial to the shareholder, and thus a driver of the share price.
Return On Investment: The time value of money for an Equity investment, i.e., the return provided by the entire cost of the investment. Similar to Interest, which the time value of money for a Debt investment.
Return on Total Assets Ratio: A Profitability Ratio, calculated as Operating Income divided by Total Assets.
Revenue: Money that comes into the business. An accounting category.
S
Sales, General & Administrative Expense: Operating expenses not directly related to production. These costs of running the business are approximately fixed, and may be referred to as Indirect Expenses or Overhead. Depreciation is included as an item in SG&A, which is recorded on the Income Statement.
Salvage Value: The residual value (what someone will pay) for an asset once it has reached the end of its Useful Life. Salvage Value may be negative if the company has to pay to get rid of the asset.
Segregation of Duties: A business control to ensure that more than one person is involved in a transaction, e.g. the person who approves a purchase is not the same person who receives it.
Share: A unit of ownership in a company. The value of a share fluctuates depending on the number of shares and the amount of shareholder equity that a company has.
Share Capital: Shareholder direct investment in a business.
Share Price: The value of a Share on the market.
Shareholder: An investor in a business who has equity rather than debt.
Shareholder’s Equity: Share capital plus Retained Earnings. Also called Equity or Capital.
Short Term Credit Line: A Current Liability. A loan that can be called by the lender at any time. Usually unsecured, but often with conditions with respect to working capital or other operating metrics.
Short Term Investment: A Current Asset that can be borrowed against to raise cash.
Stakeholder: A person or organization in society that is affected by an organization.
Statement of Cash Flow: A financial statement documenting all the flows of funds into and out of a company. Used to predict the position of the short-term credit line to ensure that no cash crisis occurs.
Statement of Retained Earnings: A financial statement documenting the cumulative value that has been kept in the business as of the end of a reporting period.
Sunk Costs: Costs incurred in the past. Sunk costs are not counted for Present Worth Analysis, which only considers future cash flows.
T
Taxes Payable: A Current Liability, booking an obligation of a tax payment that has yet to be made. Similar in nature to an Accrued Expense.
Times Interest Earned Ratio: A Leverage Ratio, calculated as Earnings Before Interest and Taxes divided by Interest Charges.
Timing: Recognizing expenses and revenues in the same reporting period, so that management has a clear picture of whether value is being created in that period. Sometimes the end of a reporting period comes between the times of related activities. This could offset expenses and revenue so that they appear in two different reports, which would create the appearance that expenses are occurring that are not related to creating revenue. An example of timing is “postponing” expenses related to work in progress as an asset until the period in which the sale is booked as receivable revenue, at which point the value of asset in finished goods inventory is converted to COGS expense.
Total Asset Turnover: An Activity Ratio, calculated as Annual Sales divided by Total Assets.
Total Debt to Total Assets Ratio: A Leverage Ratio, calculated as Total Debt divided by Total Assets. Also called Debt Ratio.
Tragedy of the Commons: When externalities come under pressure from overuse.
Transaction: A monetary exchange with a Debit on one side and a Credit on the other.
U
Unclaimed Capital Cost Allowance: The residual CCA that has not yet been claimed, because of declining balance.
Useful Life: How long an asset is expected to last before it is no longer able to perform its function. Usually expressed in years.
V
Valuation: An assessment of the market value of a company, from one of two perspectives: what the assets are worth to purchase or replace; or what the business is worth in terms of its earning power.
Vicarious Liability: The personal legal liability that person has if they violate the law in the course of their work.
W
Warranty: An obligation to provide a service without charge to the customer for a predefined initial period as a condition of sale. Warranty work is one of the costs subtracted from Gross Revenue to calculate Net Revenue, along with Bad Debt and Allowances and Returns.
Weighted Average Cost of Capital: The weighted average of the costs of sources of financing (debt and equity). Often used as the Minimum Acceptable Rate of Return for a no-risk investment. If an investment doesn’t yield at least WACC, then it will reduce the company’s performance (since the company’s current activities are already yielding WACC).
Widget: A whimsical generic term for a unit of product.
Windfall: Unexpected business revenue, reported as a gain in Other Income.
Work In Progress: Partially completed product, held as an Asset.
Working Capital: Current Assets minus Current Liabilities
Writedown: A reduction in the Book Value of an Asset, as decided by management. Entered as a loss (a negative entry) in Other Income.
Write Off: A Writedown of an asset to zero value.
XYZ
List of Abbreviations
BV: Book Value
CCA: Capital Cost Allowance
COGS: Cost of Goods Sold
∆IRR: Incremental Internal Rate of Return
EAIR: Equivalent Annual Interest Rate
EBIT: Earnings Before Interest and Taxes
FV: Future Value
IRR: Internal Rate of Return
MARR: Minimum Acceptable Rate of Return
NPV: Net Present Value
ROI: Return On Investment
SCF: Statement of Cash Flow
SG&A: Sales, General and Administrative Expense
WACC: Weighted Average Cost of Capital
WIP: Work In Progress
UCC: Unclaimed Capital Cost Allowance
Interest Calculations
Uniform Series Compound Amount: The future amount F at the end of n periods after depositing a sum A at the end of each period with interest rate i. In interest tables, use F = A x (F/A, i, n). The formula for direct calculation is:
Uniform Series Sinking Fund: The amount A that would have to be deposited at the end of the period for n periods with interest rate i to yield the future amount F. In interest tables, use A = F x (A/F, i, n). The formula for direct calculation is:
Uniform Series Capital Recovery: The size of payments A required at the end of each period to pay back a present sum P over n periods with interest rate i. In interest tables, use A = P x (A/P, i, n). The formula for direct calculation is:
Uniform Series Present Worth: The present sum P that would be required to invest now to provide end-of-period payments of A for n periods with interest rate i. In interest tables, use P = A x (P/A, i, n). The formula for direct calculation is:
Arithmetic Gradient Present Worth: The present sum P from depositing a uniformly increasing series of sums, G, 2G, etc., for n-1 periods with interest rate i. In interest tables, use P = G x (P/G, i, n). The formula for direct calculation is:
Arithmetic Gradient Future Worth: The future worth F at the end of n periods, from depositing a uniformly increasing series of sums, G at the end of the second period, 2G at the end of the third period, etc., to (n-1)G at the end of period n, with interest rate i. In interest tables, use F = G x (F/G, i, n). The formula for direct calculation is:
Geometric Series Present Worth: The present sum P from depositing an increasing series of sums, A at the end of period 1, (1+g) ·A at the end of period 2, etc., up to a deposit of (1+g)n-1·A at the end of period n with interest rate i. In interest tables, use P = A x (P/A, g, i, n). The formula for direct calculation is:
otherwise:
© MG Lipsett 2021