Stress: Other Measures of Stress
Engineering vs True Stress:
During material uniaxial tests, the value of the applied stress is obtained by dividing the applied force  by the measured initial cross sectional area of the specimen
  . In this case, the stress is termed the “Engineering Stress”. If excessive decrease (or increase) in the cross sectional area occurs, then the force should be divided by the actual area
  (area after deformation) to obtain the “True Stress”:
![\[ \sigma_{eng}=\frac{F}{A_0}\qquad \sigma_{true}=\frac{F}{A} \]](https://engcourses-uofa.ca/wp-content/ql-cache/quicklatex.com-5c7f68e766056b9e28c93f0cd85a871f_l3.png "Rendered by QuickLaTeX.com")
Similarly, the “Engineering Strain” as defined in uniaxial strain measures is obtained by dividing the elongation  by the original length
  , while the “True Strain” is obtained by taking the natural logarithm
  :
:
![\[ \varepsilon_{eng}=\frac{L-L_0}{L_0}\qquad \varepsilon_{true}=\ln{\frac{L}{L_0}}=\ln{(1+\varepsilon_{eng})} \]](https://engcourses-uofa.ca/wp-content/ql-cache/quicklatex.com-c8f799b2460bc82682f140252dd1c833_l3.png "Rendered by QuickLaTeX.com")
Considering the behaviour of metals, at higher strains, the deformation of a metal is volume preserving and thus:
![\[ A_0L_0=AL\Rightarrow A=\frac{A_0}{1+\varepsilon_{eng}} \]](https://engcourses-uofa.ca/wp-content/ql-cache/quicklatex.com-f7064fdb1639c8ba9c930bf7ac9ec9c7_l3.png "Rendered by QuickLaTeX.com")
In this case, the true stress is related to the engineering stress as follows:
![\[ \sigma_{true}=\frac{F}{A}=\frac{F}{A_0}\frac{A_0}{A}=\sigma_{eng}(1+\varepsilon_{eng}) \]](https://engcourses-uofa.ca/wp-content/ql-cache/quicklatex.com-b20d7c400c9aaa5c8eb01fe74c07797b_l3.png "Rendered by QuickLaTeX.com")
Example:
The engineering stress vs. the engineering strain of a metal is given by the following table:
| Engineering Strain (%) | 0 | 0.1 | 0.2 | 0.4 | 0.5 | 1.0 | 2.0 | 3.0 | 4.0 |
| Engineering Stress(MPa) | 0 | 200 | 400 | 600 | 630 | 690 | 750 | 790 | 810 |
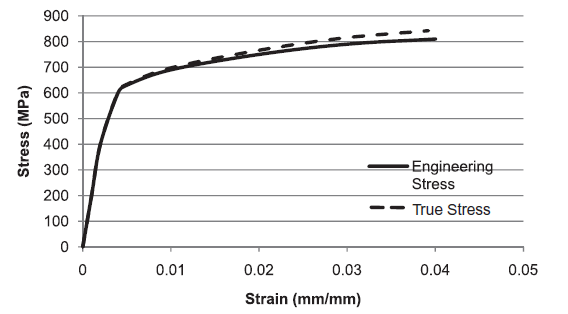
Compute the true stress and the true strain. Plot the engineering and the true stress vs. strain relationships.
Solution:
The following table is constructed using the equations for the true stress and true strain:

 (mm/mm) (mm/mm) |
0 | 0.001 | 0.002 | 0.004 | 0.005 | 0.010 | 0.020 | 0.030 | 0.040 |
 |
0 | 0.001 | 0.001998 | 0.00399 | 0.004988 | 0.00995 | 0.0198 | 0.02956 | 0.0392 |
 (MPa) (MPa) |
0 | 200 | 400 | 600 | 630 | 690 | 750 | 790 | 810 |
 (MPa) (MPa) |
0 | 200.2 | 400.8 | 602.4 | 633.15 | 696.9 | 765 | 813.7 | 842.4 |
As shown in the plot below, the values of the true stress for metals are usually slightly higher than the values of the engineering stress for strains higher than 0.005.