
CivE 381: Soil Mechanics: CivE 381 Labs
Lab 1: Soil Compaction Standard and Modified Proctor Test
Lab 2: Hydraulic Conductivity
LAB 2: HYDRAULIC CONDUCTIVITY
Purpose
To verify Darcy’s Law and determine the coefficient of permeability of a homogeneous soil and a layered soil system in a virtual constant head permeability test. According to Darcy’s Law, the quantity of fluid flow through the soil is proportional to the hydraulic gradient. The hydraulic gradient ( ) is defined as the loss of total head (
 ) across a flow path of length (
 ). Hydraulic gradient is expressed as:
![\[ i = \frac{dH}{L} \]](https://engcourses-uofa.ca/wp-content/ql-cache/quicklatex.com-b2d397997b91481bf4310a8cd7325203_l3.png "Rendered by QuickLaTeX.com")
Fluid will flow only if there is a total head change across a flow path. In other words, water flows down the energy line; from high total head to low total head.
Procedures
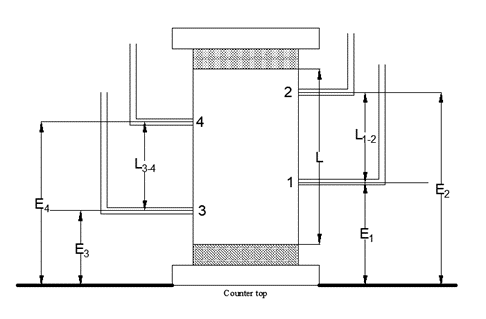
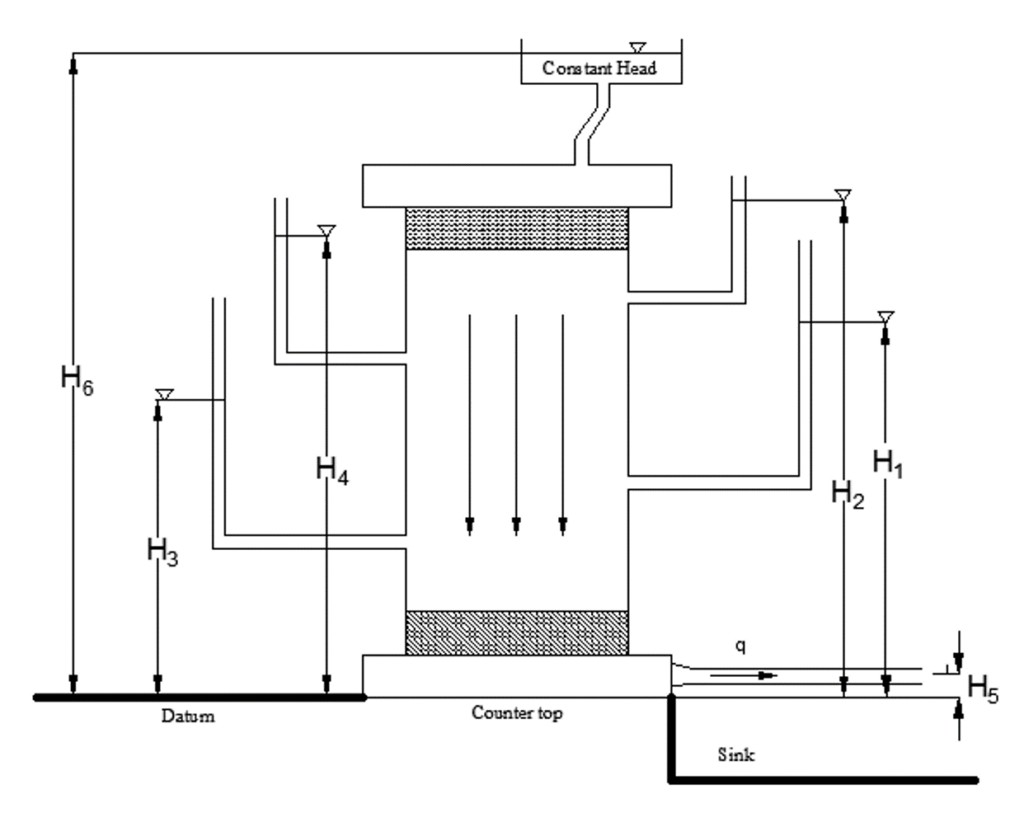
As shown in Figure 1, the model consists of 4 manometer ports to measure pressure head within the soil specimen, 2 on each side of the specimen. For the homogenous test, the permeameter is filled with a uniform coarse sand. In the layered soil system, coarse sand (1/2 length, , of specimen) is overlying fine sand (1/2 length, , of specimen). A detailed procedure on conducting the virtual simulator is attached. The virtual simulator will output the total head, Hi, at each manometer based on the constant head reservoir elevation, H6, and exit port elevation, H5, (Figure 2).
Results (both homogenous and layered test)
- Calculate and compare the hydraulic gradient across the manometers 2-1 and 4-3.
- Plot of total heads of the four manometers versus hydraulic gradient.
- Plot the calculated velocity versus hydraulic gradient across the manometers 2-1 and 4-3.
Discuss the above results paying particular attention to the concepts of gradient, head change across the sample and variability of measured values from anticipated results based on theory.
PROCEDURE
- Since the evaluations of ports (E1, E2, E3, E4) and height of exit port are given, students need to input sample dimensions (diameter and height of sample), group number and reservoir height (H6).
- Press the calculate.
- Record time for collecting water and record water level in manometers from bar chart (H1, H2, H3 and H4).
- Hit calculate and repeat measurements again. Do this 3 times for each reservoir height (H6) and average the results.
- Change the reservoir height three more times and repeat step 2 to 4.